








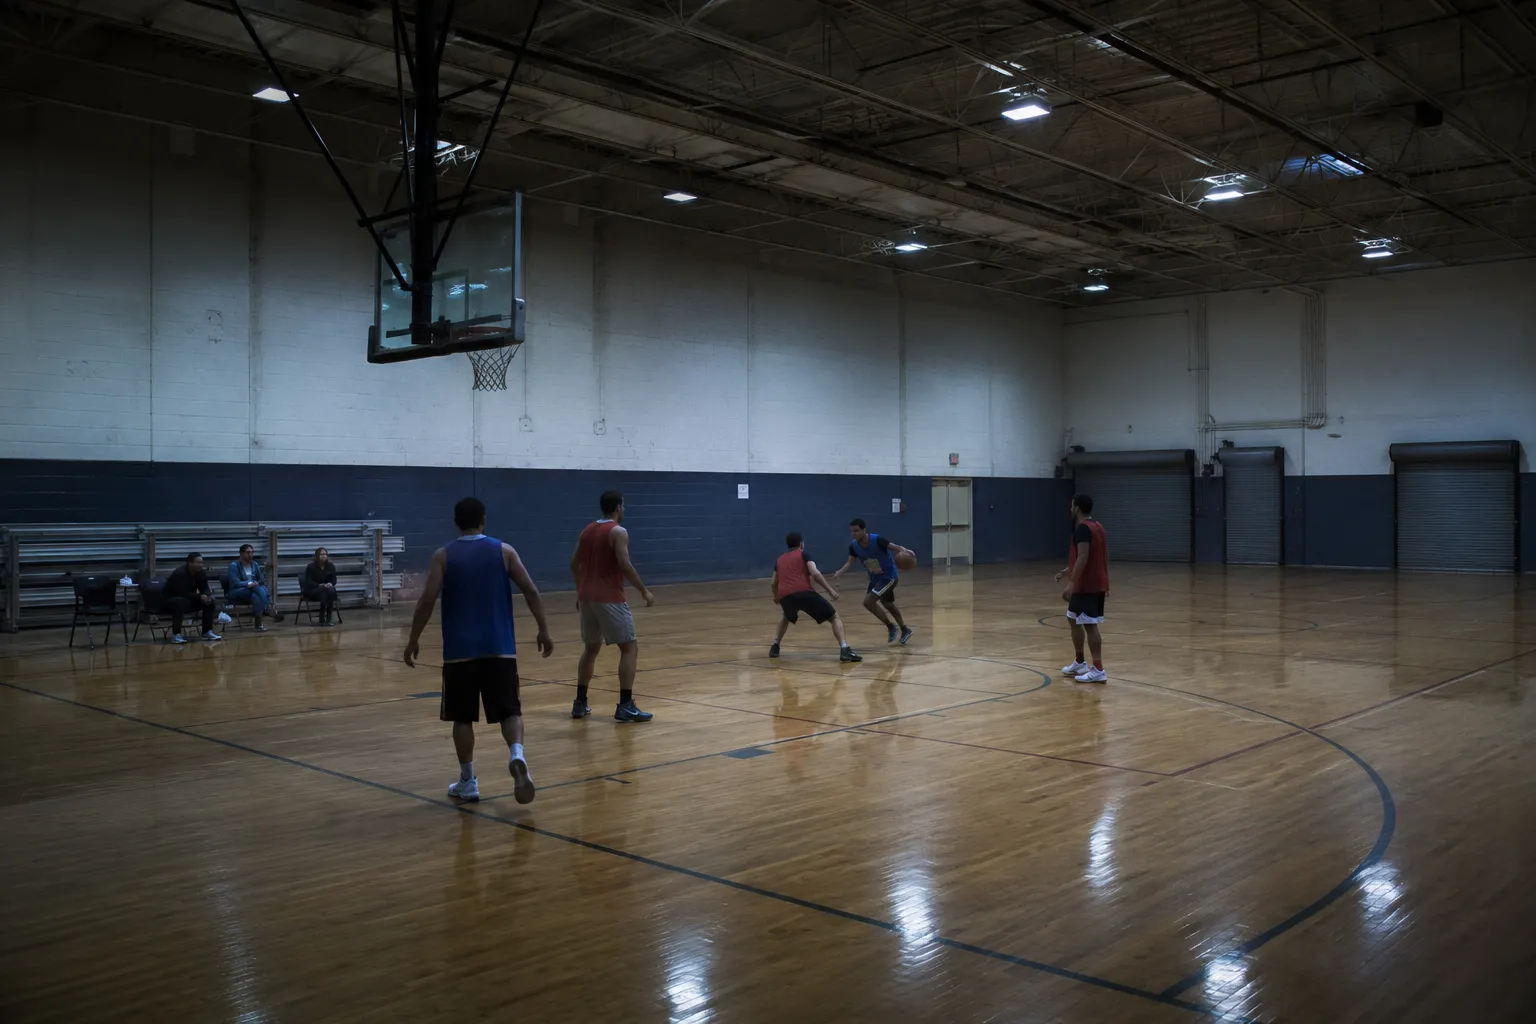
Home / Case studies / AI Automated Basketball Stats from Video for Youth Leagues
Case study · Sports analytics · Computer vision
AI Automated Basketball Stats from Video for Youth Leagues
A youth, amateur & semi-professional basketball analytics platform needed automated basketball stats from video, as hand tagging fell behind at tournaments. Brainy Neurals built a pipeline that uses computer vision to track players & score every play. Inside the platform, coaches upload ordinary game recordings & each one returns seven event types, per-player stats, clips & an annotated video. Analysts now check that output instead of tagging by hand, & the client reports lower turnaround & cost per game.
7
Event types tagged per game
Ordinary video
No new cameras or sensors
Whole tournaments
Every game gets a breakdown

Published September 2026 · Updated October 2026
At a glance
What problem did this solve?
Manual tagging of basketball games was slow & inconsistent at a youth & amateur analytics platform. Its analysts couldn’t keep up with tournament volume.
What did Brainy Neurals build?
Brainy Neurals built a video pipeline that follows every player & the ball through a whole game. Every game comes back as seven event types, per-player stats, event clips & an annotated video.
What changed after it went live?
After go-live, every uploaded game returns its stat sheet & clips without an analyst tagging it. The client reports lower turnaround & cost per game.
Who else could use this?
Automated event tagging suits any organization that still logs what happened on video by hand. That includes other sports, retail stores, warehouses, construction sites & broadcasters.
| Engagement fact | Detail |
|---|---|
| Industry | Sports analytics |
| Sub-vertical | Youth & amateur basketball |
| Client | A basketball analytics platform |
| Engagement | End-to-end pipeline build |
| Timeline | Not disclosed |
| Capabilities | Detection, tracking, events & chat |
| Delivery model | Cloud pipeline, API delivery |
Why did manual game tagging keep failing?
Manual game tagging kept failing because each breakdown depended on an analyst tagging footage by hand. The platform had promised every coach a breakdown of every game.
So it asked Brainy Neurals for automated basketball stats from video, through a computer vision development program that could take tagging off human hands.
Slower than the game
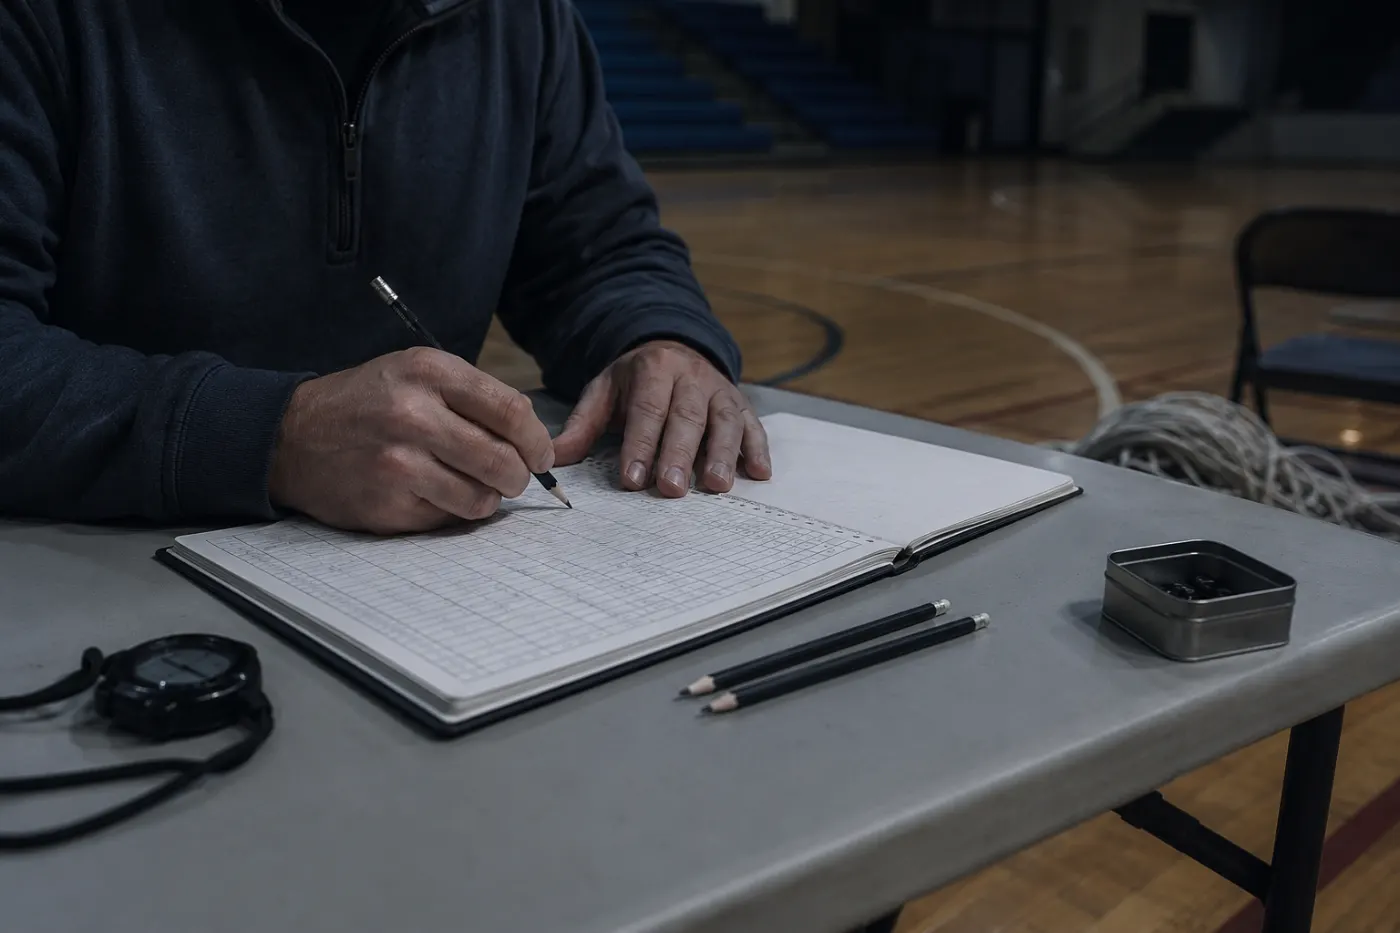
A single game took longer to tag by hand than to play, & a tournament day produced dozens.
Two analysts, two answers
Two analysts tagging one game disagreed on assists & rebounds, so the sheet changed with the person.
A growing backlog
Tournament weekends piled up untagged games faster than any analyst roster could clear them.
Too late to use
Coaches got the breakdown too late to use it, often after the next game had already been played.
Published performance analysis research gets two observers to agree by defining every action in writing first (Francis et al., 2019)[1]. Hand tagging at tournament pace skips that step.
What do teams usually try first?
Teams that need game stats tend to start with one of three approaches, & each one works up to a point.
| Approach | What it gets right | Where it stops | Who it still suits |
|---|---|---|---|
| Analyst tagging by hand | Judgment on gray-area calls | Hours per game, & it doesn’t scale | Elite programs with budgets |
| Live stats app, one scorer | Cheap & instant box score | No clips, one pair of eyes | Leagues that want a box score |
| Auto-tracking camera | Follows play, cuts highlights | Stats stop at highlights, hardware lock-in | Clubs that mainly want broadcast |
| Software tagging of ordinary footage (this build) | Events, stats, clips & video from any recording | Needs varied footage & tuning | Platforms processing games at volume |
How we built automated basketball stats from video
Brainy Neurals built an automated video intelligence pipeline for a youth & amateur basketball analytics platform.
The pipeline reads each game frame by frame & keeps one identity per player from tip-off to buzzer. It also splits the players into their two teams.
Our video analytics work on crowded scenes is where that tracking came from. Event logic then reads the play from how the players move around the ball & the net.
Each upload runs through the pipeline once & comes back as a finished stat sheet.
Infer events from geometry
A make is the ball passing through the net. Rules like that can be read & tuned with a coach in the room.
A coach can argue with a rule, but nobody can argue with a black box. So we rejected one model that predicts events end to end, since it needs far more labeled footage & fails without warning.
Queue games, don’t stream them
A game is uploaded as a file, queued, processed & delivered back to the platform. Live courtside processing would have meant hardware in every gym. Because the volume lives in tournament peaks, a queue absorbs a peak where a live system falls over.
A coach can argue with a rule, but nobody can argue with a black box.
The technology stack we used
The technology stack answers one constraint, which is hundreds of thousands of long game videos a year at youth league prices. All of that video runs on shared GPUs, the graphics chips that do the heavy math.
So we kept the models small & built the pipeline around streams of video. The service layer on top of it stays light. A generative AI development layer sits above that, so a coach can question the sheet in plain English.
| Layer | What we used | Why | What we ruled out |
|---|---|---|---|
| Detection | Compact object detectors per target | Each target fails differently | One big model |
| Player tracking | Tracker that reads jersey numbers, persistent IDs | Same player, whole game | Appearance-only matching |
| Events & scoring | Rules over geometry & zones | A coach can argue with it | One classifier per event |
| Inference | Shared GPU inference, reduced precision | Cheap per game at volume | Frame by frame on CPU |
| Service layer | A light async service layer | The platform polls for progress | A workflow engine |
| Storage | Cloud storage & portable exports | Simple to move & to read | Managed database, for now |
| Analytics chat | A language layer tied to the sheet | Every answer traces to a row | Ungrounded chat |
What happens after a coach hits upload?
One uploaded game passes through five steps before a coach sees its stats.
- Upload. A coach uploads a game recorded in a community gym, & the file lands in cloud storage to join the queue.
- Detect & track. The pipeline reads the footage frame by frame & finds every player on the floor. It tracks the ball & the net too, then holds one identity per player for the whole game. A final pass separates the two teams.
- Read the play. Event logic watches how the players move around the ball & the net. It calls possessions, shots, makes, rebounds, assists, steals & blocks. A court map read from the footage places each shot against the three-point line, so a make scores from one to three points.
- Build outputs. Stats compile per player, timestamped to the event, & export as CSV, a plain spreadsheet file. Clips are cut around each key event. An annotated video renders with the scoreboard on screen & a labeled trail behind each player.
- Deliver. When the run completes, the platform is told it is done & the outputs come back as links a coach can open. The coach reads the sheet or asks the assistant a question.
Five steps turn an uploaded game into a timestamped stat sheet.
What went wrong on the court?
Real gym footage broke the early tracking in four places.
- The ball vanished at the moments that mattered. Small & fast, it was usually hidden behind the players chasing it, so it went missing at release & at the rim.
- Player identities swapped between players in matching kits. When two of them crossed, the tracker handed each one the other’s number for a whole quarter. Jersey numbers didn’t fix it, because a number is readable in only a few frames (Balaji et al., 2023)[2].
- Team colors blurred together under gym lights. White against light gray was a coin toss. Referees & the bench kept getting pulled into a team as well.
- Every gym turned out to be a different court. US high school arcs sit at 19.75 feet (6.02 meters), while FIBA arcs sit at 22.15 feet (6.75 meters). A zone map built on one floor put threes in the wrong place on the next.
Tracking benchmarks blame two of the same problems, fast uneven motion & look-alike players (Cui et al., 2023)[3]. Problems like these call for specialist engineers rather than another analyst.
How we fixed each tracking problem
Each tracking problem got an engineering fix, & none of the four needed a new model.
The net is a steadier witness to a made shot than the ball leaving a hand.
The vanishing ball
We stopped demanding the ball in every frame & started trusting the net instead. A make became the ball passing through the net, a steadier signal than a blur leaving a hand.
Swapped identities
We made identity a running judgment instead of a single snapshot. Evidence gathered across the whole game outweighs any one bad frame. Team color narrows the choice, & a player can’t be in two places at once.
Blurred teams
We let each game define its own two teams rather than matching a fixed color list. The court boundary keeps referees & the bench out of both.
A different court every night
The pipeline reads the lines in each recording & maps the zones from them. So the three-point zone always matches the arc painted on that floor.
Fixing the pipeline before training anything new is how we work on every build.
What changed after go-live?
After go-live, automated basketball stats from video replaced hand tagging for every game uploaded.
No outcome figure was measured, so the diagram shows who does the work.
| Measure | Before | After |
|---|---|---|
| Tagging | An analyst, one possession at a time | Automatic, for every game uploaded |
| Stat sheet | Box score typed by hand | Per player, timestamped, exported as CSV |
| Clips | Cut by hand for a few moments | Cut around every key event |
| Delivery | When an analyst got to it | Links a coach opens, on completion |
| Questions | Wait for the analyst | Ask the chat assistant |
We haven’t published a turnaround or cost figure for this build. The client reports that both fell, but we only print numbers that we have measured ourselves.
Analysts now check the output instead of tagging every possession. The platform can take a tournament’s full slate today instead of the handful its analysts could reach.
The stat sheet now reaches clubs that could never have paid for an analyst.
Still tagging game footage by hand?
Tell us what your analysts still log from video & we’ll show where a pipeline like this one fits. You can also check how ready your data & team are for AI first.
What runs in production today?
The pipeline runs in production inside the client’s platform today, behind its own upload & status endpoints. Every uploaded game goes through that same chain of steps.
Brainy Neurals built the pipeline for tournament-scale volume rather than a handful of showcase games. Capacity grows by adding workers, & no extra analysts are needed.
Performance analytics like this used to stop at elite programs, & now it reaches academies & club teams too.
What would we do differently?
We’d change four things if we started this build again.
Trust the net from day one
We spent weeks chasing per-frame ball detection before accepting that the net is the steadier witness to a make.
Read the court from the footage before training anything
A fixed zone template cost us a rebuild after the second venue.
Agree the stat definitions with coaches before tagging a single game
An assist means different things to different coaches, & a model can’t settle that argument.
Build the queue before the models are good
The pipeline shape decided whether the platform could survive a tournament weekend, more than the model did.
An assist means different things to different coaches, & a model can’t settle that argument.
Where else does this pattern fit?
Automated video event tagging is software that logs what happened in footage by tracking the people & objects in it. It fits wherever people still watch recordings & write down what happened.
The logic that calls a rebound can log a pallet pick or a near miss.
| Industry | The equivalent problem | What changes in the build |
|---|---|---|
| Other sports | Soccer, hockey, volleyball & other team sports, with the same backlog | New event rules & a different field map |
| Retail | Shopper paths & shelf interactions logged by hand | Shelf zones for court zones, dwell for possession |
| Warehouse operations | Pallet moves & near misses go unrecorded | Forklifts & pallets replace players & ball |
| Construction | Safety breaches logged by a walking supervisor | Exclusion areas for zones, breaches for events |
| Broadcast | Editors cutting highlights by hand | Same clip engine, new event set |
Porting the pipeline means writing new event rules & mapping the new space. Then it needs real footage from that setting to tune on.
What does it take to repeat this?
How does AI basketball stat tracking work?
Automated basketball stats from video start with detectors that find players, the ball, the net & jersey numbers in every frame. A tracker follows each player, & event logic calls seven event types from how the players move around the ball & the net. Court zones read from the footage then assign the points.
How accurate is AI basketball stat tracking?
Brainy Neurals doesn’t publish accuracy figures for client systems. Every event on the sheet carries a timestamp, so a coach can check any call against its clip in seconds. The client’s analysts now review output instead of tagging from scratch.
Do I need special cameras or sensors?
You don’t need sensors or special cameras for this pipeline. It was built for ordinary game recordings, & its court zones are read from the footage itself. Footage that keeps the whole court in frame helps the tracking.
Does AI stat tracking work for youth & high school games?
Youth games work, even though small gyms with mixed lighting make the footage harder than broadcast. Players of every size are identified by jersey number & team color rather than by face, which matters when players are minors.
How long does it take to build automated game tagging?
Automated game tagging needs time to watch your own footage fail first. Brainy Neurals starts with a proof of concept on your recordings, then hardens the pipeline around what broke. Event set & footage variety decide the calendar, so we agree the scope with you before any build starts.
How much does a custom sports video analytics system cost?
The cost of a custom sports video analytics build depends on the event set & how varied your footage is. Annual game volume moves the price as well, & we don’t quote from a form. A scoped proof of concept on your footage gets a fixed price before any code is written.
What do you still tag by hand?
Tell us what your team still logs from video or paper. If a pipeline like this one fits, you'll hear how, & if it doesn't, you'll hear that too.
Services behind this case study
The services below cover this build & the next steps it could take.
Computer vision development
The detectors for players, the ball, the net, jersey numbers & poses started here.
Video analytics
Tracking fast, look-alike people across long recordings is the same problem a busy site camera faces.
Generative AI development
The chat layer answers a coach’s question straight from the stat sheet.
RAG development
Grounding a language model in your own data means every answer cites a row.
Edge AI
The same detectors can move onto a courtside device when a venue needs results at halftime.
AI in sports
We build player tracking & performance analytics for sports leagues & analytics platforms, from youth up.
Not ready for a full build yet? An AI proof of concept tests the idea on your own footage first, & AI consulting helps shape the roadmap around it.
You can also take the AI readiness assessment or browse all industries we work in.
Cite this case study
Shah, Rushabh & Sangani, Harshil. AI Automated Basketball Stats from Video for Youth Leagues. Brainy Neurals, August 2026. https://brainyneurals.com/case-studies/automated-basketball-video-stats/
Sources cited on this page
- Francis et al., 2019. https://doi.org/10.3389/fpsyg.2019.00016
- Balaji et al., 2023. arXiv:2309.06285. https://arxiv.org/abs/2309.06285
- Cui et al., 2023. arXiv:2304.05170. https://arxiv.org/abs/2304.05170