








Case study · Site plan analysis · Computer vision and document AI
Measuring site plans without manual scale conversion
A European land development consultancy was interpreting site plans by hand to identify plots, measure boundaries, and verify construction offsets. Brainy Neurals built a site plan analysis pipeline that detects the drawing’s structure and converts pixels into real-world units. Boundary lengths, plot area, and setback distances now return annotated on the original drawing.
Also called a situation plan, a plot plan, or a Lageplan.

Mitesh Patel, Founder & Director, NVIDIA Certified AI Architect.
He set the measurement architecture for this build and ruled on which numbers the system was allowed to report.
Published August 2026 · Last updated August 2026 · 12 min read
02 · Quick answers
At a glance
Q. What problem did this solve?
Site plans hold boundaries, dimensions, and scale markers as drawn lines and printed text. Reading one meant an expert measuring every distance by hand.
Q. What did Brainy Neurals build?
Brainy Neurals built a site plan analysis system for a European land development consultancy. Two vision models find the drawing’s parts, and optical character recognition reads its printed dimensions.
Q. What changed after it went live?
Site plan analysis now runs in one pass. A surveyor uploads a drawing, gets the measurements back on that image, and plans the system cannot read are refused.
Q. Who else could use this?
Site plan analysis suits any team that measures land from drawings rather than from a fresh survey. Property, insurance, cadastral, utility, and solar teams all qualify.
03 · The problem
Why is measuring a plan still manual?
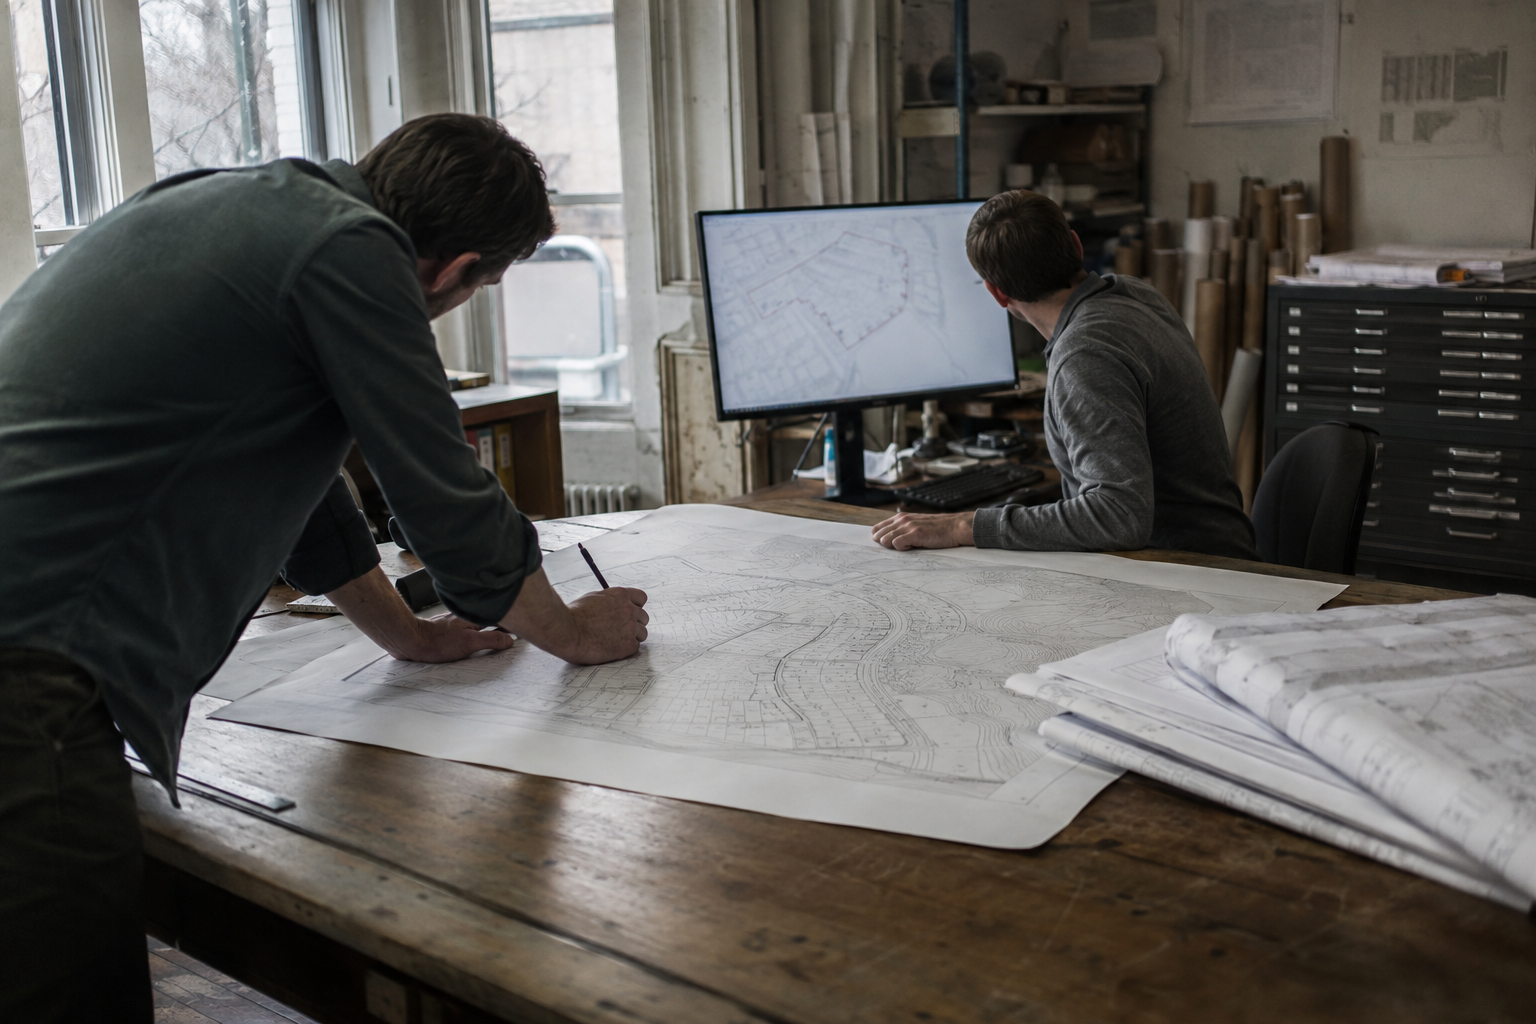
A European land development consultancy works from site plans every day. Each drawing carries plot boundaries, neighbouring structures, dimension labels, a scale marker, and an ownership block. Pulling one number out of that meant opening the file and measuring by hand.
Which is the sort of work intelligent document processing was supposed to have removed years ago. Nobody enjoyed it.
- Every review started by reading the ownership block, then hunting for the matching outline.
- Every distance began as a pixel length, became a scale conversion, and ended as a typed figure.
- Every folded or faded scan turned a five-minute check into a phone call to the archive.
- Every second reviewer produced a second answer, and neither could show their working.
- Every batch of forty plans for one land verification run cost a week nobody had.
None of this is unusual. A 2026 study of buildings documented only by their scanned plans reached exactly the same verdict [1].

04 · The field
What have teams already tried here?
Four routes, all reasonable.
| Approach | What it gets right | Where it stops | Who it still suits |
|---|---|---|---|
| Manual CAD or PDF viewer | Exact when the file is vector | Nothing is automated | Small volumes, clean files |
| Takeoff software | Fast, mature, built for quantities | An operator still traces every line | Estimators working plan by plan |
| General multimodal model | Reads printed text well | Miscounts and mislocates drawn symbols | Summaries, not measurements |
| Trained vision pipeline | Finds and measures without tracing | Weeks of drawing-specific work | Volume, mixed scan quality |
A 2026 benchmark on real architectural and engineering drawings found much the same split between the four. General models scored well on reading text and stalled near half on counting drawn symbols [2].
Tried this and stopped at the same wall? Tell us where it stopped.
Tell us where it stopped05 · The design
How we designed the analysis pipeline
Brainy Neurals designed the whole pipeline around a single rule about where numbers come from. The drawing is the only source of truth, so every number has to come off the drawing.
That rule cost us the easier design. We rejected the option of pulling boundaries from a parcel register and matching them onto the plan. The plan and the register disagree often enough to matter, and the drawing is what the client signed.
So the system works on land that no register covers. Which happens more than you would think.
“The drawing is the only source of truth, so every number has to come off the drawing.”
The second decision was to look at the page before looking at the plot. A first model finds the drawing area, the scale marker, the legend, and the ownership block. A second model works only inside that area, tracing boundaries, buildings, and adjacent structures as outlines.
So object detection does the finding, and plain geometry does the measuring. Never the other way round. No model is ever asked to predict a distance, because a model that guesses will guess plausibly.
06 · The stack
The technology stack we used
Every layer here had to survive a scan of completely unknown quality. We chose each one for how it behaves when the input is poor, which is most of the time. The same technology selection questions come up on nearly every drawing project we take.
| Layer | What we used | Why | What we ruled out |
|---|---|---|---|
| Input and preparation | |||
| Input formats | Plan images and scanned PDFs | What the client already holds | CAD-only ingestion |
| Preprocessing | Deskew, denoise, contrast lift | Scans arrive folded and grey | Rejecting poor scans outright |
| Detection and reading | |||
| Structure detection | Compact object detection model | Finds the page regions first | Segmenting the whole image |
| Object segmentation | Instance segmentation model | Boundaries need outlines, not boxes | Bounding boxes for plots |
| Text extraction | Character recognition tuned for drawings | Dimensions sit small and rotated | Generic page-level reading |
| Geometry and delivery | |||
| Scale resolution | Calibration from printed dimensions | A stated ratio rarely survives a scan | Trusting the scale text |
| Geometry | Polygon, length, and offset computation | Area and distance are arithmetic | Model-predicted measurements |
| Delivery | Overlay on the original image | Users check against what they know | A separate numbers-only report |
07 · One plan through
How does one plan get processed?
One plan, from upload to answer, in the order the system actually works through it.
- The image is deskewed and cleaned, so a folded scan stops looking like a curved boundary.
- The first model marks the page regions: drawing area, scale marker, legend, and ownership block.
- Character recognition reads the text in those regions, capturing dimension figures, the scale line, and the owner’s name.
- The second model traces the drawing area into outlines: plot boundaries, buildings, balconies, and adjacent structures.
- The scale is fixed by matching a printed dimension to the pixel length of the line it labels.
- Geometry closes each boundary, then computes area, perimeter, and the distance from every structure to its plot line.
- The main plot is matched to the ownership block, highlighted, and annotated back onto the original image.
Seven steps, and every number in the answer traces back to a mark on the drawing.
Want this walked through on your own drawings? Book 30 minutes with Mitesh Patel.
No pitch. If it is not a fit, you will know in five minutes.
08 · What broke
The three failures we did not expect
Three things went wrong, in this order.
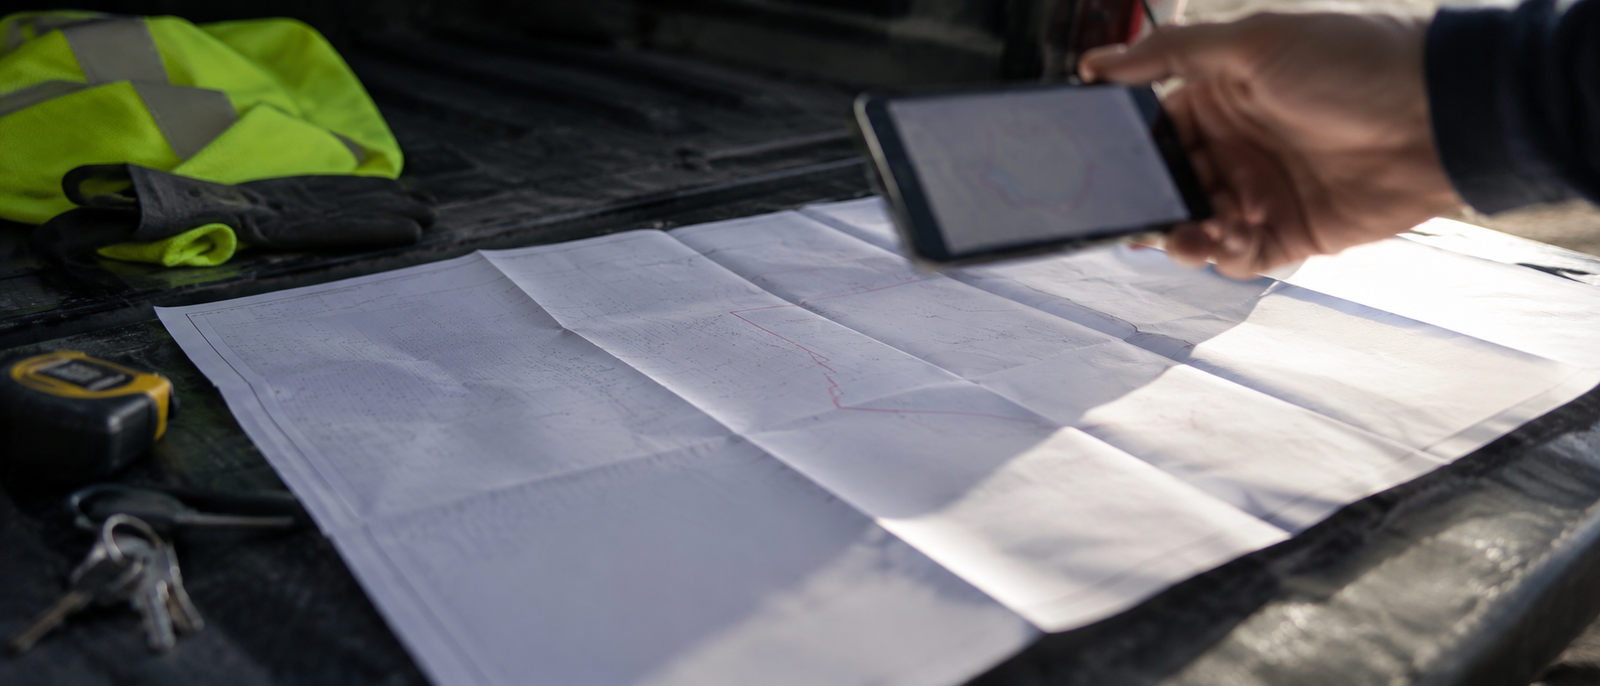
The stated scale lied. A plan printed at one ratio, photocopied slightly small and scanned askew, is no longer at that ratio. Our first areas came back wrong. Confidently wrong.
Then boundaries closed around the wrong land. Neighbouring plots share edges, and a driveway crossing a line merged two parcels into one. The polygon still closed, and the area still looked plausible.
Character recognition was the third, because dimension text is small, rotated, and printed over hatching. European drawings also write twelve and a half as 12,50, and a lost comma gives you 1250.
A published comparison of reading tools on architectural drawing text found the current ones inadequate [3]. A controlled study found a five percent scale error moves total area by ten percent [1].
Because this is where clients ask about specialist engineers.
09 · The repair
What we changed to fix them
Each fix is short to describe. None was short to find.
FIX 01Scale
We stopped reading the stated ratio and started measuring it instead. The system pairs each printed dimension with the line it labels, then derives pixels per metre. Plans where the pairs disagree are refused, not estimated.
FIX 02Boundaries
We retrained the segmentation model on crossings, driveways, and annotations that run over a line. Then we added a check that has nothing to do with the model. Where the plan prints its own area, the computed area must match it.
FIX 03Text
Dimension crops are rotated upright, tied to their line, and read against both decimal conventions.
A scale rule carries six scales on three faces and has no moving parts at all. It is the only tool in this story that never needed replacing.
This is the work a proof of concept exists to surface, before anything is promised.
10 · The change
What changed after go-live?
| What | Before | After |
|---|---|---|
| Where the measuring happens | By hand, in a viewer | In one pass, on upload |
| Who reads the scale | A person, from the label | The system, from the drawn dimensions |
| What a second reviewer gets | A second set of numbers | The same numbers, shown on the plan |
| Plans that stop the process | Faded, folded, or unclear | Refused, with the reason given |
| Cost of the fortieth plan | The same as the first | Close to nothing |
We have not published a time, an accuracy, or an error rate, though the client reports the direction is positive. A number we have not measured is a number we will not print.
What changed day to day is smaller than that, and more useful. A reviewer opens the annotated plan, sees the boundary the system used, and either agrees or does not.
So the argument is now about the drawing rather than about somebody’s arithmetic.
What do your drawings need to tell you?
Send the problem, not a brief. A sentence about what you measure by hand today is enough to start.
11 · In production
What is running today
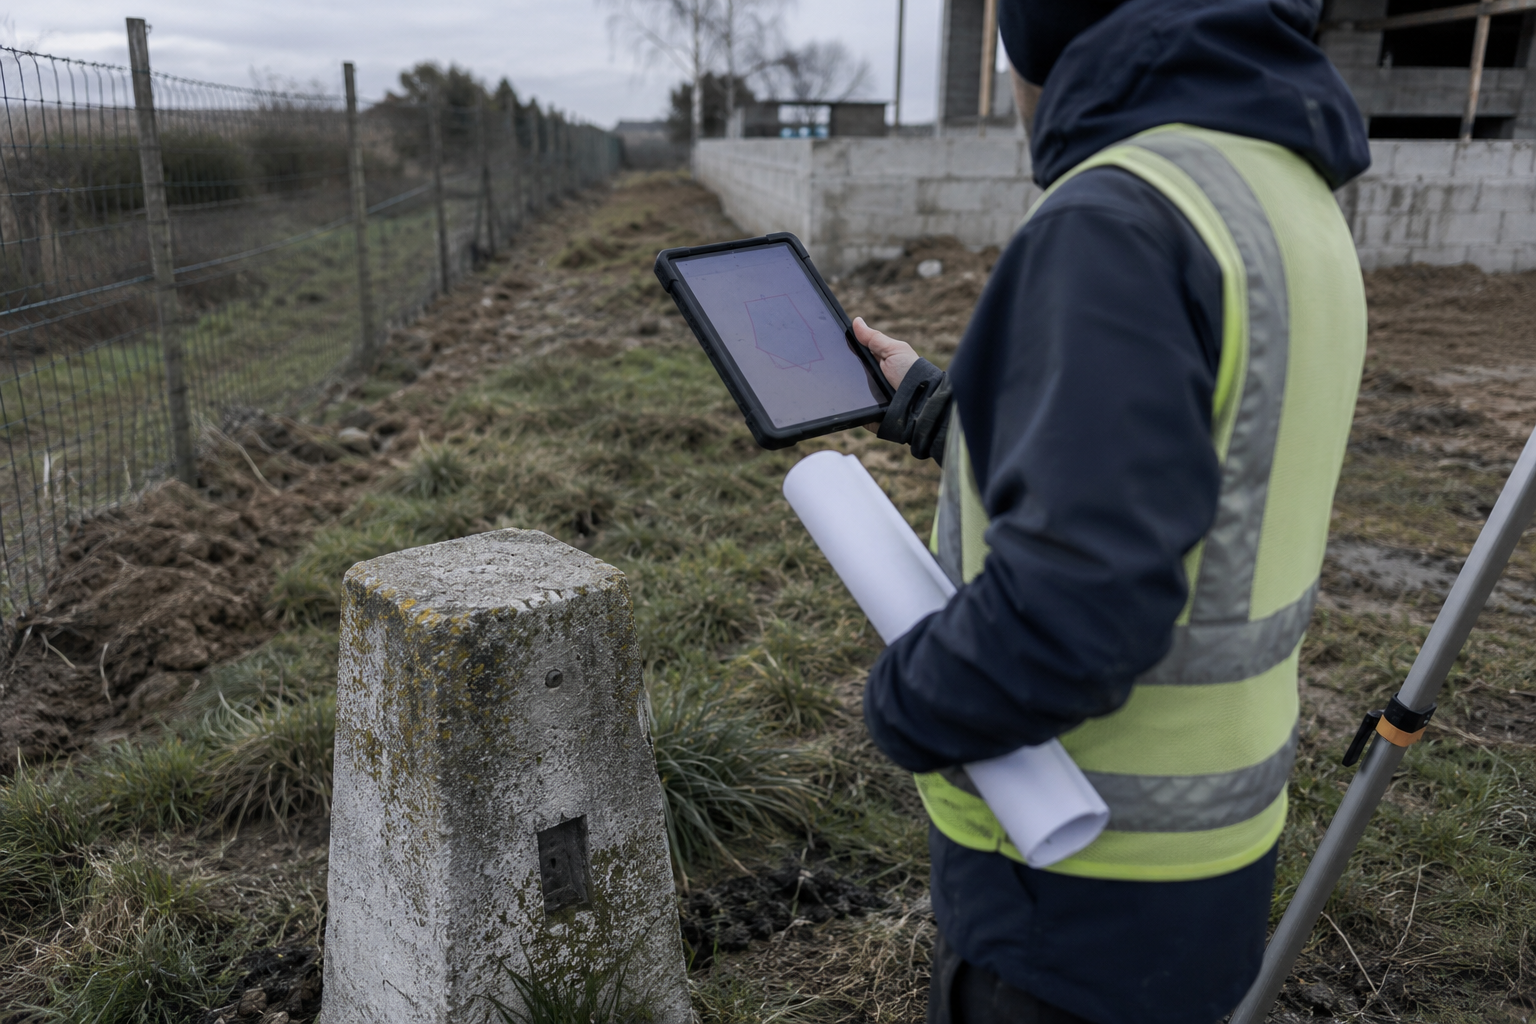
The site plan analysis system runs in production on the consultancy’s own plans. Surveyors and civil engineering staff use it for plot verification and for checking offsets before documentation goes out.
Since handover, the plan set has widened well past the drawing styles we started with. Nothing about the pipeline changed when the drawings got worse, and refusals still go to a person.
The annotated overlay is still the interface, and nobody has asked for the numbers on their own.
12 · Hindsight
What would we do differently?
LESSON 01Calibrate before you segment
We built the boundary work first and treated scale as a conversion at the end. Scale is the foundation of this system, and everything above it inherits the error.
LESSON 02Ask what the drawing already tells you
The plans printed their own areas all along, and we ignored that for weeks. A drawing that states a fact is a drawing that can check us.
LESSON 03Collect the ugly scans on day one
Our sample was clean, because clean files are what get emailed. The folded, faded, over-copied ones are the real population.
LESSON 04Decide early what a refusal looks like
A stated scale is a claim about how a sheet was printed, not a measurement. Deciding when to refuse is a product call, made far too late.
“A stated scale is a claim about how a sheet was printed, not a measurement.”
13 · The pattern
Where else does plan reading fit?
Site plan analysis is a system that turns a drawn plan into measured geometry by calibrating pixels to real units. It belongs wherever the drawing is the record and no fresh survey exists.
| Industry | The equivalent problem | What changes in the build |
|---|---|---|
| Real estate and property | Confirming plot area before a transaction | Title-block reading, area against the register |
| Government and planning | Checking a situation plan against setback rules | Cadastral reference, rules as an input |
| Insurance | Measuring distance from a building to a hazard | Wider plans, more adjacent structures |
| Utilities and telecom | Checking clearances inside an easement corridor | Long thin drawings, corridor-first geometry |
| Manufacturing | Plant layouts and equipment clearances | Denser symbols, tighter tolerances |
| Solar and renewables | Usable area and setbacks from every edge | Sloped surfaces, exclusion zones as inputs |
Porting takes a retrained detector, a look at the scale markers, and the client’s worst scans.
14 · Buyer questions
Questions buyers usually ask
How it works
Can AI read a site plan and calculate the plot area?
Yes, provided the drawing prints the dimensions that it is going to be measured from. A vision model finds the boundary, character recognition reads the dimensions, and geometry converts pixels to real units.
Does site plan analysis replace a licensed land survey?
No. Site plan analysis measures the drawing you already have, to the accuracy that drawing allows. A stamped survey measures the ground. Use the first for review and triage, and the second when a boundary is actually contested.
Will it work on scanned or photographed plans?
Usually. Deskewing, cleaning, and calibrating from printed dimensions handle most scans, folds, and phone photos. Quality still sets the ceiling, so the system reports what it could not read instead of guessing.
Does it check a plan against zoning or setback rules?
Not on its own. The system measures the distances a rule would be applied to, and reports them on the drawing. Testing those numbers against a rule set is a separate layer that needs the rules supplied.
Time, cost, and rollout
How long does it take to build a site plan analysis system?
A proof of concept on a folder of your own real drawings usually takes a few weeks. Structure detection, boundary segmentation, and scale calibration each need a pass, and production follows once the refusal behaviour is agreed.
How much does a drawing analysis build cost?
The cost depends on drawing variety, how much text must be read, and what already exists. Brainy Neurals scopes it from a short call and a folder of your real plans, then quotes a fixed price. An AI readiness assessment tells you first whether your drawings carry enough to measure.
Sources cited on this page
- [1]Guo Y, Zhou X, Tang S-K. LLM-Integrated Semantic Deep Learning Framework for Automated Floor Plan Analysis, Area Estimation, and Compliance Assessment of Existing Buildings. Applied Sciences. 2026;16(13):6290. DOI 10.3390/app16136290.
- [2]Kondratenko A, Birhane M, Hsain HE, Maciocci G. AECV-Bench: Benchmarking Multimodal Models on Architectural and Engineering Drawing Understanding. arXiv:2601.04819. 2026.
- [3]Schonfelder P, Stebel F, Andreou N, Konig M. Deep learning-based text detection and recognition on architectural floor plans. Automation in Construction. 2024;157:105156. DOI 10.1016/j.autcon.2023.105156.
If your record of a site is a drawing, tell us what you need measured from it.
Or book 30 minutes directly.
15 · Built from
The services this was built from
Document AI services
Turning drawings, forms, and scans into structured numbers, with refusal rules where the source fails.
Computer vision development
Detection and segmentation models trained on your drawing conventions, not somebody else’s dataset.
AI consulting
Deciding what to automate on a document pipeline, and where a person still signs.
POC and MVP development
A short build on your own worst files, sized to answer whether the rest is worth doing.
Hire AI developers
Vision and document engineers who extend your team for the weeks the drawings fight back.
AI in civil engineering
Systems for firms whose record of a site is a drawing, not a live model.
An AI readiness assessment tells you whether your drawings carry enough to measure. Our engagement models set how a build runs, and the industries hub shows where the pattern already fits. The AI services list covers what sits either side of it.
16 · Adjacent proof
Other builds with this shape
Three more Brainy Neurals builds, each shipped into a working environment rather than a demo.
Overhead Line Geometry Measurement
Stereo cameras on a moving train measuring overhead wire geometry, with the inference running on board.
READ THE CASE → Case study · R / 02AI Diet Assistant for Gastroenterology
Clinical dietary guidance generated under review gates, running live in a working healthcare setting.
READ THE CASE → Case study · R / 03Personalised AI Meal Planning for Chronic Care
Structured meal plans built from messy personal health data, each one grounded and reviewable.
READ THE CASE →Cite this case study
Patel, Mitesh. Measuring site plans without manual scale conversion. Brainy Neurals, August 2026. https://brainyneurals.com/case-studies/ai-site-plan-analysis/