







Home / Case studies / AI Medical Document OCR for Report Summaries in Diagnostic Labs
Case study · Clinical diagnostics · Document AI
AI Medical Document OCR for Report Summaries in Diagnostic Labs
An Indian diagnostic laboratory group needed medical document OCR because its clinicians read every lab & radiology report by hand before each consultation. Brainy Neurals built a pipeline that uses AI to read each page & fill one fixed summary. Running in production across the group’s full intake, the pipeline hands clinicians one summary page instead of eleven pages read by hand. The client reports that document review time fell by 60 to 80 percent, with no extra clinicians hired.
60 to 80%
Less document review time
Every report
Summarized before each consultation
One page
Read instead of eleven

Published October 2026
At a glance
What problem did this solve?
Clinicians at an Indian diagnostic laboratory group read every lab & radiology report by hand before each consultation. The reading was slow, & two practitioners could read the same report differently.
What did Brainy Neurals build?
Brainy Neurals built a medical document OCR & summarization platform for the group. Its pipeline reads mixed report layouts & returns one structured output using document AI & generative AI.
Engagement facts
- Industry Healthcare & clinical diagnostics
- Client type Indian diagnostic laboratory group
- Engagement Clinical document intelligence platform
- Timeline Not disclosed
- Capabilities Document AI & generative AI
- Delivery model Project-based delivery
What changed after it went live?
Clinicians now open a standard summary instead of a stack of documents. The client reports that document review time fell by 60 to 80 percent, with no extra clinicians hired.
Who else could use this?
Any team that reads long documents before deciding something can use this pattern. Claims reviewers & legal teams carry the same reading load. Pharmacovigilance desks carry it too, coding adverse event narratives under regulatory deadlines.
Why did reading reports take so long?
Reading reports took so long because an Indian diagnostic laboratory group receives lab & radiology reports from dozens of sending systems. Every report starts at a sample collection counter, then arrives in whatever layout its issuer produced. Each medical document OCR tool the group had looked at, including intelligent document processing products, assumed a fixed template.
Clinicians then read every page before the consultation, hunting by eye for the values that mattered.
- Twelve pages, four values. A clinician opened a full panel & read all of it.
- Two readers, two readings. Practitioners wrote up different highlights from one report.
- Unfamiliar layouts. Reference ranges got hunted by eye, column by column.
- Buried results. A value deep in a long document got missed often enough to worry staff.
- Nothing structured. Every downstream dashboard was assembled by hand afterwards.
The cost of that reading reaches well beyond this one client. A time & motion study across four specialties put 49.2 percent of the physician office day into record & desk work[1]. For this group, report reading was eating into the consultation time it was meant to prepare for.

Where do the obvious fixes fall short?
Three of the four common routes for reading medical documents stall once layouts vary from sender to sender. Each one still solves a real part of the problem. None of those three survives a daily stream of mixed layouts, which is where this client lived.
| Approach | What it gets right | Where it stops | Who it still suits |
|---|---|---|---|
| Template extraction | Precise on a layout it knows | Breaks when the layout changes | Stable forms from one source |
| Generic cloud OCR | Reads printed text well | Attaches no clinical meaning | Archiving & keyword search |
| A general model alone | Writes fluent summaries fast | Believes the text it’s handed | Clean digital text, low stakes |
| OCR plus clinical layer, our route | Structure & meaning together | More build work up front | Mixed layouts read daily |
The model itself is rarely the weak link. A reader study with ten physicians rated adapted model summaries equal to or better than medical experts in most comparisons[2]. The failures come from the route the text takes before it reaches the model.
How we built the medical document OCR pipeline
Brainy Neurals built the platform as one pipeline, & each stage hands a checked artifact to the next. A report comes in & gets classified, then it is read & summarized against a fixed schema. Values are extracted from the page & carried into the summary, so none of them is generated.
The first design decision kept reading separate from understanding. Cloud OCR on its own returned text with no idea which number was a result & which was a range. So a clinical layer sits between the OCR output & the summary, tagging sections before generative AI development touches them.
The second decision made the schema the contract. Every summary fills the same fields in the same order, whatever the source layout did with them.
When a field has no supporting text in the document, it stays empty instead of getting filled with a guess. The model writes the summary, & the pipeline decides what the model may see.
The model writes the summary, & the pipeline decides what the model may see.
Every stage from intake to summary runs inside one boundary, & each field keeps its source.
What technology stack runs the pipeline?
The stack runs eight layers, & every one of them had to survive a report it had never seen. We picked each layer for how it behaves on a bad scan. The same layers show up in the AI agent development work we do for other document-heavy teams.
| Layer | What we used | Why | What we ruled out |
|---|---|---|---|
| Ingestion | Format-agnostic intake | Scans & faxes land the same way | A parser per format |
| OCR engine | A specialist document OCR model | Keeps tables attached to text | Generic line-based OCR |
| Section tagging | Rules & a model together | Rules where cheap, model where not | A model for everything |
| Summarization | A model under a fixed schema | Output shape is constrained | Free-form prompting |
| Grounding | Source spans on every field | Nothing reaches a summary unsupported | Review after the fact |
| Orchestration | A graph-based pipeline runner | Retries & branches per document | Linear scripts |
| Service layer | A Python API service | One contract for every consumer | Direct database access |
| Output | Records plus a summary | Dashboards read one, clinicians the other | A rendered file only |
How does one report get processed?
One lab or radiology report passes through six stages between arrival & the clinician. The classifier sets the schema early, so every later stage knows what to expect.
- The file arrives & gets normalized into pages before anything tries to read it.
- A classifier decides what kind of report it is, which sets the schema for every later stage.
- Next, the OCR layer reads each page & keeps tables attached to their own text. Columns & headings stay attached the same way.
- Section tagging comes from the clinical layer, so results & reference ranges stop blurring into narrative findings.
- From that tagged text, the language model fills the schema, & every field carries the span it came from.
- Finally, the structured record goes to downstream systems & the rendered summary goes to the clinician.
All six stages run on every report, & a clinician sees only the output of the last one.
What broke first & how we fixed it
Three failures surfaced in the first weeks of running real reports through the pipeline. Each one taught us something the demo phase could not.
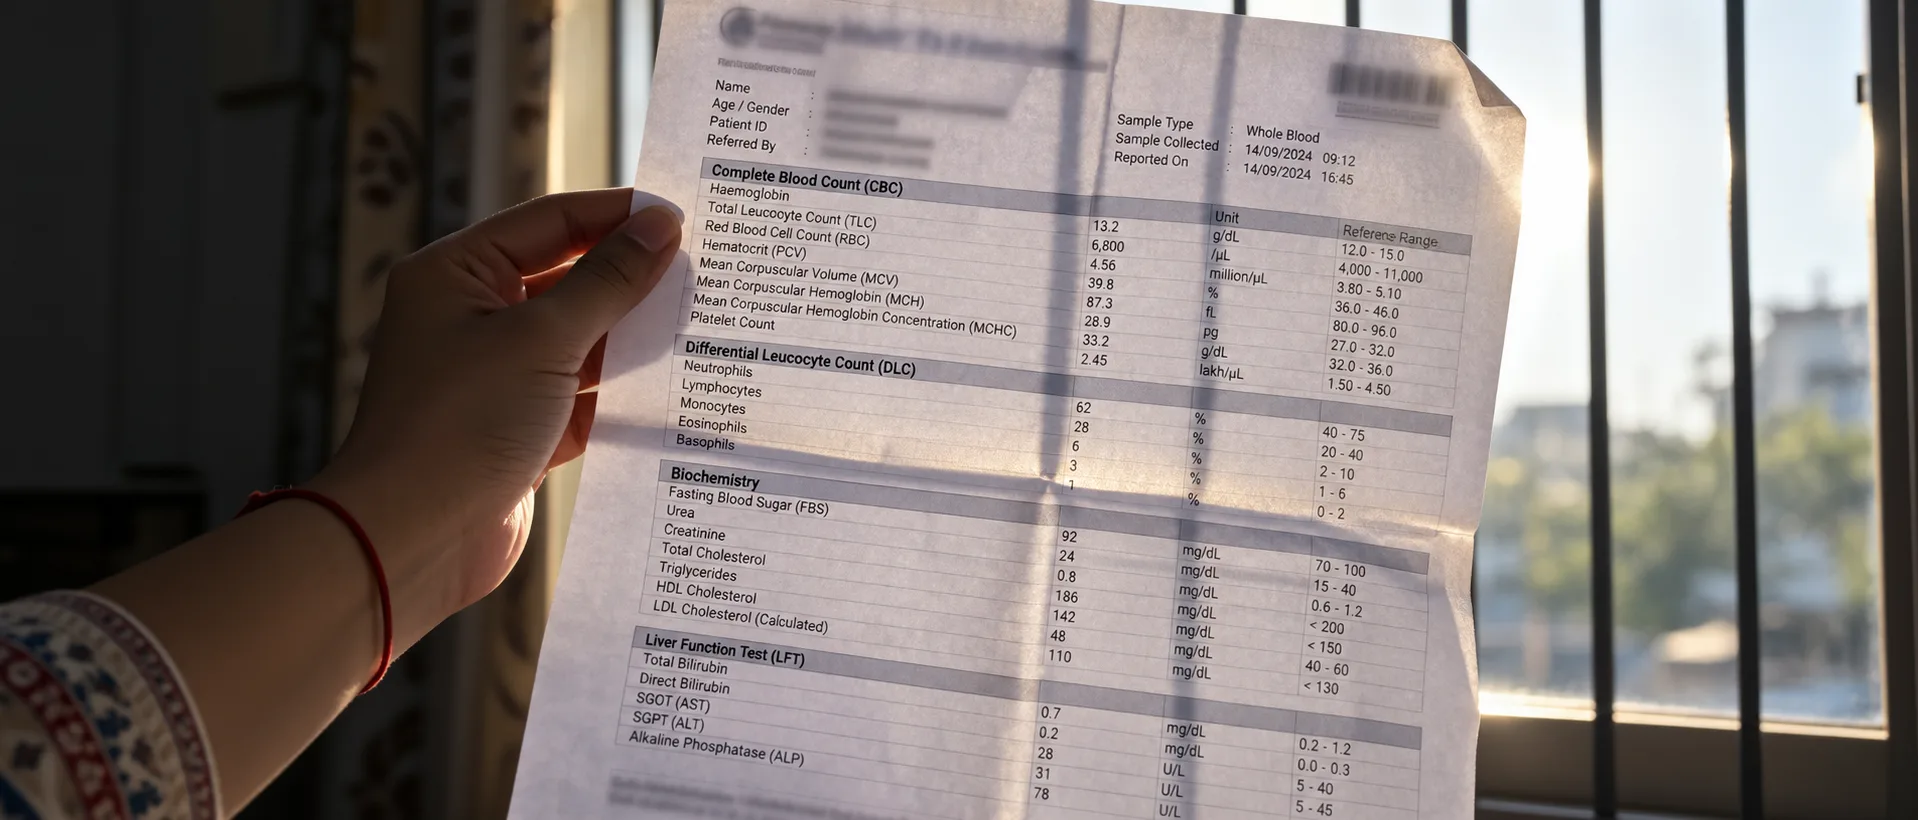
The first version summarized text the OCR layer had misread. Nothing in that output looked wrong, because a fluent summary of bad text reads like a good one. Finding the problem took longer than building the pipeline did.
Layout variety broke the section tagger far more often than the OCR. One report printed its reference ranges in a separate right-hand column instead of beside each value they belonged to. The tagger read that column as narrative prose, & the summary dropped the ranges entirely.
The schema itself kept growing underneath us. Every new report type carried one more field nobody had planned for, & each addition risked changing summaries that had already been reviewed.
Score every span, gate the low ones
We scored every extracted span & stopped the pipeline from summarizing anything below a threshold. A page under that line goes to a person instead of the model, & it still does.
Teach the tagger geometry
We rebuilt the section tagger to read geometry as well as text, so a column & a caption differ. Then we ran it against every layout the client had on file, including the messy ones.
Version the schema, pin each summary
We versioned the schema & pinned each summary to the version it was written under. Adding a field no longer rewrites anything already reviewed.
The manual process this replaced was never perfect either. Manual chart abstraction carries a pooled error rate of 6.57 percent across the published literature[3]. The confidence threshold started life as a debugging aid & ended up as the safety mechanism.
Weeks like these are when clients hire AI developers as specialist engineers rather than learning the failure modes live on real intake. A proof of concept exists to surface exactly this work before anything gets promised.
What changed after go-live?
After go-live, the client reports that document review time fell by 60 to 80 percent on the medical document OCR platform. That range is the client’s own, measured on its own workload, & we have not audited it. We report it as the client’s figure & not as a Brainy Neurals measurement.
The platform now runs in production across the client’s full report intake. Every incoming lab & radiology document passes through it before a clinician opens anything at all.
Day to day, a practitioner walks into a consultation having read one page instead of eleven. No extra clinicians were hired to carry that gain.
Since handover, the client has added report types by extending the schema instead of rebuilding the pipeline. Low-confidence pages still route to a person, & that rule has not been relaxed once. Document work in AI in healthcare earns that kind of caution.
Because the output is structured, clinical summaries now arrive in one format from every sending system. The dashboards that used to be assembled by hand now fill themselves.
The payoff clinicians describe is the timeline. A patient whose blood was drawn at four different laboratories across 5 months now shows every result on one chart. The trend reads in one glance instead of ten page turns.
| What changed | Before | Now |
|---|---|---|
| Who reads the full report first | A clinician, page by page | The pipeline |
| Output format across senders | Whatever the sender produced | One schema |
| Variation between practitioners | Two readers, two readings | One summary, reviewed |
| Machine-readable clinical data | None existed | Structured records per report |
| Adding a new report source | Another manual reading habit | A classifier entry & a test |

Ten results drawn at four laboratories across 5 months, on one timeline. The record is illustrative, built for this diagram, & holds no real patient data.
Want this walked through on your own reports?
Book a 30 minute call with Mitesh Patel, with no pitch attached. If it isn’t a fit for your reports, you’ll know within 5 minutes.
What would we do differently?
Four lessons from this build would change how we run the next one. Each is easy to describe, though none of them was quick to find.
Measure OCR quality before writing prompts
We tuned summaries for weeks against text that was already wrong. That order cost us most of a sprint, & the next build reverses it.
Design the schema for versions from day one
We treated the schema as settled, & it never was. Document projects grow fields, so the next schema plans for versions from its first field.
Build the review path before the model needs it
A fluent summary of misread text is the failure that hurts, because nothing about it looks wrong. We now wire in the routing rule first.
Keep the source span on every field
Shipping a clean summary & adding provenance later is tempting. The provenance is the product, so it goes in with the first commit.
Where else does document AI fit?
Document AI fits wherever people read long documents before making a decision. It turns mixed-format documents into structured records by reading layout & meaning together.
Porting this build starts with a new schema & a fresh layout survey. A review threshold agreed with the client completes the port to a new field.
Insurance claims
Adjusters read claims packets page by page before adjudication, the same load clinicians carried here. The build swaps in a policy schema & fraud flags for much longer documents, a close fit for AI in banking & finance.
Legal discovery
Lawyers read discovery bundles for a handful of facts buried across thousands of pages. Citation down to page & line replaces clinical section tagging, & retention rules get stricter.
Logistics paperwork
Customs & shipping documents get keyed in by hand before goods can move. Builds for AI in logistics add tighter turnaround targets & more numeric validation.
Pharmaceutical safety
Safety teams read & code adverse event narratives by hand under regulatory deadlines. The build adds a regulated audit trail & coded medical terminology.
Banking onboarding
Identity & income documents get checked one by one during onboarding. Verification gets stronger here, because a wrong rejection costs more than a slow approval.
What do buyers ask before building this?
Buyers weighing a build like this one usually ask these six questions first, & each answer stands on its own.
Can AI read a scanned lab report accurately enough to trust?
Scanned lab reports can be trusted to AI when every extracted value carries a confidence score & weak pages go to a person. A pipeline that returns text with no score gives a reviewer nothing to check.
What does OCR mean in a healthcare context?
In healthcare, OCR usually means optical character recognition, the reading of text from a scanned page. In compliance talks it can also mean the Office for Civil Rights, which enforces HIPAA. This case study is about the first meaning.
Which medical documents can a pipeline like this handle?
Lab panels, radiology reports, discharge summaries, referral letters & intake forms all work with a pipeline like this one. The outcome depends on whether the real layouts were surveyed before the build started.
Is medical document OCR HIPAA compliant?
HIPAA compliance belongs to the deployment rather than the OCR engine, so a pipeline like this can meet it. Encryption, access control, audit logging, a signed business associate agreement & a boundary the data never leaves are what matter.
How long does it take to build one of these?
A proof of concept on your own documents usually runs a few weeks. The layout survey & schema design each need their own pass, & so does the review threshold. Production follows once the summaries hold on real intake.
How much does a clinical document AI platform cost?
Cost depends on how many report types & layouts you have, & on what already exists. Brainy Neurals scopes it from a short call & a sample of real documents, then quotes a fixed price. An AI readiness assessment tells you first whether your documents are consistent enough to automate.
What are your clinicians reading right now?
A short note about the reports your team reads is enough to start. Mitesh Patel reads every message sent through this form.
Services behind this case study
Brainy Neurals delivered this build from five standing services, listed below with what each one contributed.
Document AI services
Medical document OCR & extraction pipelines that survive the layouts your senders actually use.
Generative AI applications
Summaries written under a fixed schema, with every field traced back to its source text.
RAG development services
Retrieval across your own corpus, so each answer arrives with the page behind it.
AI agent development
Workflow automation that carries a document from classification through to release.
AI in healthcare
Clinical systems built where a wrong output costs more than a slow one.
A proof of concept tests this on your own reports before any wider build. AI consulting helps decide what to automate first, & the industries hub shows where this pattern already runs.
Similar case studies
One earlier Brainy Neurals case study shares the shape of this build.
AI Diet Assistant for Gastroenterology
Clinical dietary guidance generated under review gates, live in a healthcare setting.
Cite this case study
Mori, Prasiddh & Patel, Mitesh. AI Medical Document OCR for Report Summaries in Diagnostic Labs. Brainy Neurals, September 2026. https://brainyneurals.com/case-studies/medical-document-ocr-clinical-summaries/
Sources cited on this page
Three published studies back the external claims on this page. Every other number comes from the client’s own report or our build record.
- Sinsky C, Colligan L, Li L, Prgomet M, Reynolds S, Goeders L, Westbrook J, Tutty M, Blike G. Allocation of Physician Time in Ambulatory Practice: A Time and Motion Study in 4 Specialties. Annals of Internal Medicine. 2016. Volume 165, issue 11, pages 753 to 760. DOI 10.7326/M16-0961. PMID 27595430.
- Van Veen D, Van Uden C, Blankemeier L, Delbrouck JB, Aali A, Bluethgen C & colleagues. Adapted large language models can outperform medical experts in clinical text summarization. Nature Medicine. 2024. Volume 30, issue 4, pages 1134 to 1142. DOI 10.1038/s41591-024-02855-5.
- Garza MY, Williams T, Ounpraseuth S, Hu Z, Lee J, Snowden J, Walden AC, Simon AE, Devlin LA, Young LW, Zozus MN. Error rates of data processing methods in clinical research: a systematic review and meta-analysis. International Journal of Medical Informatics. 2025. Volume 195, article 105749. DOI 10.1016/j.ijmedinf.2024.105749.