






Home / Case studies / Edge AI Overhead Wire Measurement on Moving Rail Vehicles
Case study · Rail electrification · Edge AI & computer vision
Edge AI Overhead Wire Measurement on Moving Rail Vehicles
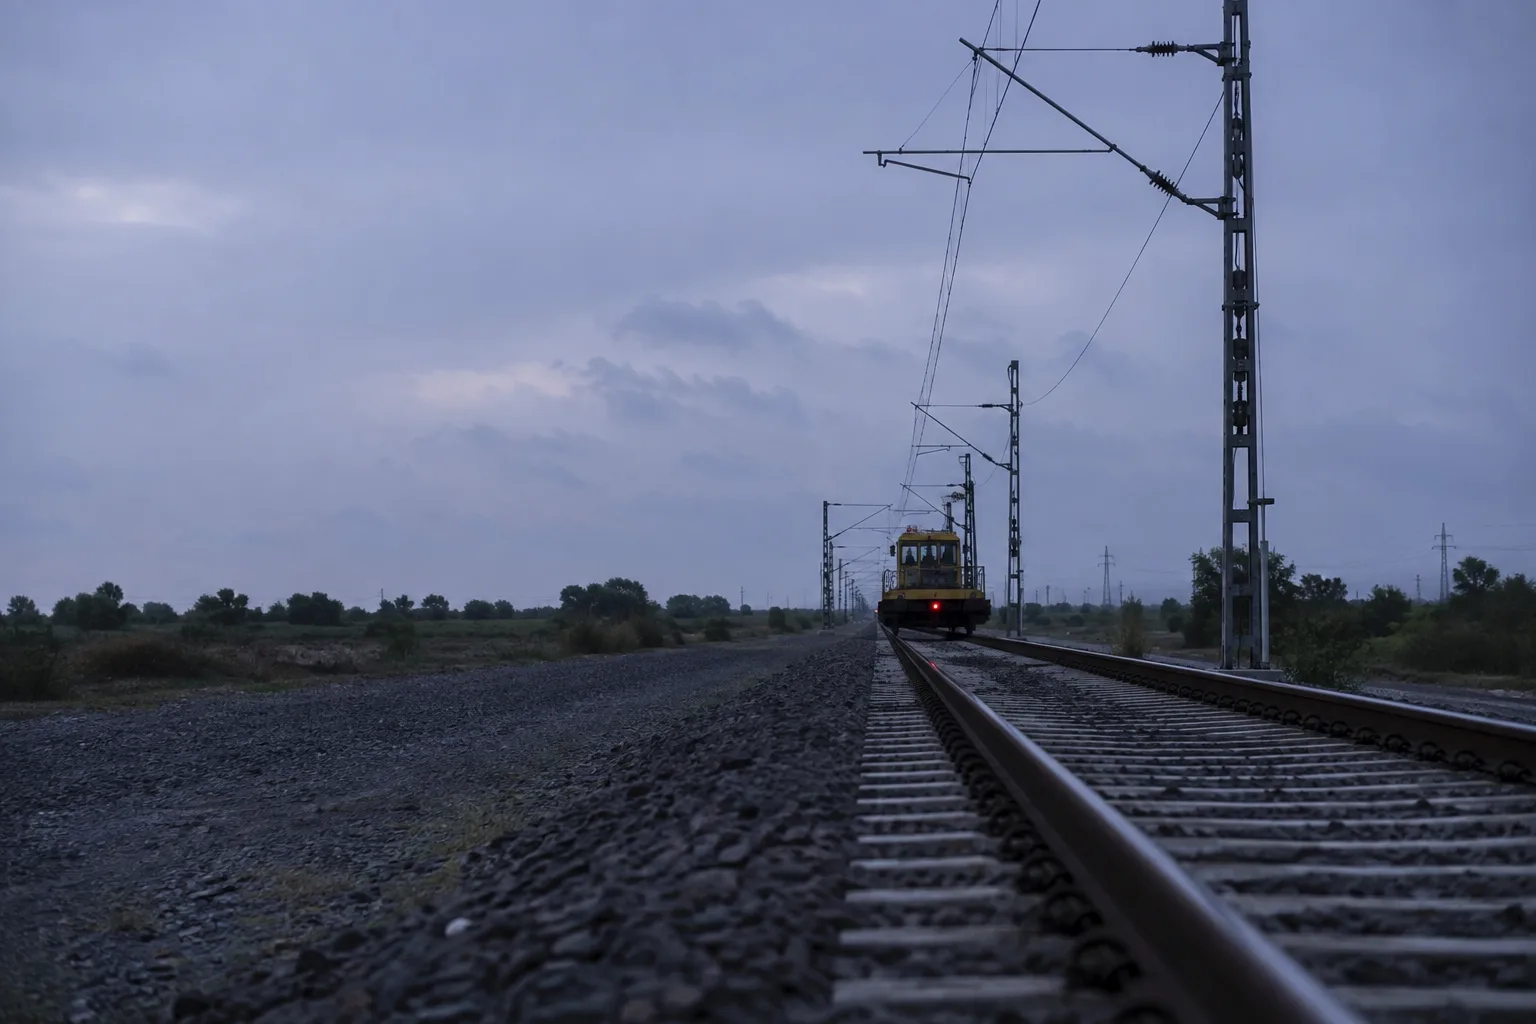
A rail infrastructure contractor on a national electrified network did overhead wire measurement by hand, mast by mast, with the line closed to traffic. Brainy Neurals built a vehicle mounted system that uses computer vision & depth sensing to read every mast. Everything runs on board at working speed, so crews see each reading at the mast instead of walking with a gauge. The contractor reports 10 to 20 times more track covered per shift, measured across its first year, & the line stays open throughout.
10 to 20×
More track per shift
5
Readings at every mast
Line open
No closure while measuring

Published August 2026 · Updated October 2026
What did the engagement cover?
| Field | Detail |
|---|---|
| Client | A rail infrastructure contractor operating on a national network |
| Sector | Rail electrification maintenance |
| Problem | Wire geometry checked by hand, mast by mast |
| What we built | Vehicle mounted vision system reading five parameters live |
| Where it runs | On the vehicle, while it moves |
| Coverage change | 10 to 20 times more track per shift |
| Status | In production |
Why did manual wire surveys keep failing?
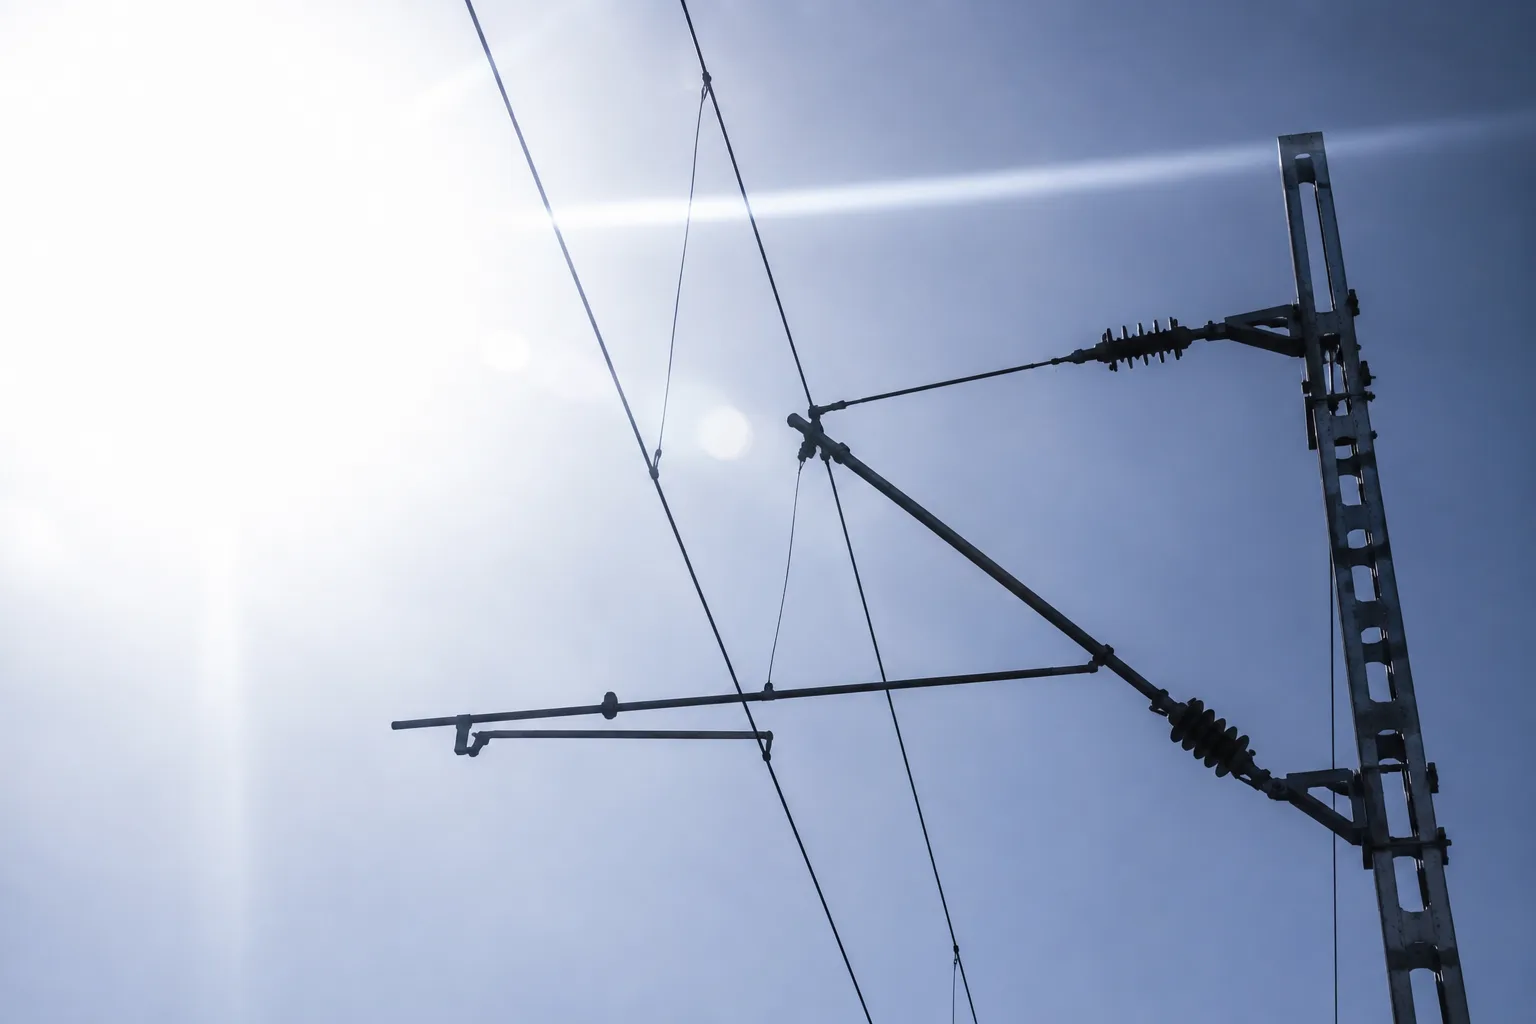
Manual surveys kept failing because overhead wire measurement relied on people holding gauges. The wire above an electrified track weaves from side to side on purpose, & engineers call that weave stagger.
Stagger stops the pantograph, the arm that collects power, from wearing a groove in one place. Every weave has to stay inside tolerance, & only a person standing under the wire with a gauge could confirm it.
Stagger is one of the few things on a railway built out of straight on purpose.
Measuring by eye & hand is the kind of job that computer vision development took over in other fields years ago.
- Two people walk the track with a laser gauge, measuring one mast at a time.
- The line has to be closed first, so surveys wait for a time window that suits operations.
- Readings go into a notebook & get typed up later, which lets a transposed number survive all the way to audit.
- Two crews measuring the same mast rarely agree, since a person holds the gauge on ballast.
Manual overhead line inspection only checks a sample each cycle, so a wire can drift out of place until a pantograph finds it.
Every manual survey has four failure points, & none of them is the measuring itself.
What do teams usually try first?
Teams usually reach for one of four alternatives first, & every operator we’ve met had tried at least one of them.
| The usual approach | Why it appeals | Where it stops |
|---|---|---|
| Better handheld gauges | Cheap, & crews already know them | One mast at a time, behind a line closure |
| Laser scanning from a survey car | Precise, & proven on track geometry | The car costs so much that it rarely visits |
| Record now, process later | Simple to fit, with no compute on board | Faults surface days after the vehicle has left |
| Manual review of roof camera footage | Uses cameras already fitted | Someone still watches every hour of it |
How does overhead wire measurement work on board?
Measuring on board starts with a camera aimed where the pantograph meets the wire. Brainy Neurals built this vehicle mounted computer vision system for a rail infrastructure contractor on a national network.
A camera on its own gives you a picture rather than a distance, so we paired it with depth sensing. That makes this a sensor fusion problem before it’s a vision one.
Each pass returns five numbers, which are contact wire height, stagger, mast offset, gradient & change in gradient.
The vehicle caused most of the trouble, because it rolls & bounces between frames. On a curve it leans too, which moves the camera while the wire stays exactly where it was. We run motion correction for all of that before measuring anything at all.
Everything runs on the vehicle while it moves, with no upload & no queue behind it. Each located reading is written before the next mast arrives. Crews see the number while they’re still standing beside the mast that produced it.
Everything inside the dashed box happens on the vehicle while it’s moving.
The technology stack we used
The technology stack uses parts that aren’t exotic, & the work went into how they’re arranged. Much of that effort went into making on-device inference keep pace with a vehicle moving at line speed.
| Layer | What we used | Why | What we ruled out |
|---|---|---|---|
| Capture | High frame rate camera aimed up at the wire | Freezes the wire at line speed | Consumer cameras that smear |
| Depth | Depth sensing across the same view | Gives the distance a camera cannot | Lidar, on cost & weight |
| Detection | Custom models trained on overhead rail scenes | Stock models never saw a contact wire | Road scene detectors |
| Measurement | Geometry engine turning pixels & depth into millimetres | Where the accuracy lives | Calibration that assumes a still vehicle |
| Motion | Correction for roll & pitch, with lean handled on curves | The camera moves while the wire stays put | Ignoring it, which we tried |
| Location | Satellite positioning on every reading | Engineers need the mast, not the average | Chainage typed by hand |
| Compute | On board unit running the pipeline live | Skips the upload & the queue | Cloud, & record now, process later |
What happens on one pass?
One pass runs six steps between the vehicle reaching a mast & the record being saved, all while it keeps moving.
- The vehicle runs the route at working speed, so no crew needs a possession or a window.
- The camera looks up & captures the wire & mast fast enough that nothing smears.
- Depth sensing measures the distance to that same scene at the same instant, giving two views of one moment.
- The models locate the wire & its contact point, then the mast. That detection work is the easier half of the job.
- The geometry engine turns those positions into height, stagger, mast offset, gradient & change in gradient.
- The system subtracts the vehicle’s own motion & attaches a satellite fix. Then it writes the record to structured storage.
By then the next mast is usually already in frame, & the cycle starts again.
One pass takes six steps, & the vehicle never slows down for any of them.
What nearly stopped the project?
Three problems nearly stopped the project & took up most of its time. Two of them were never vision problems at all.
- The vehicle wouldn’t hold still, & every roll or bounce moved the camera between frames. Lean on every curve made the drift even worse. Early readings drifted with the track rather than the wire, & separating the two took weeks.
- Sunlight was the second problem, because a copper wire against a bright sky nearly disappears for part of the day. At other hours the same wire acts like a mirror. The same route looked like two different problems at nine in the morning & four in the afternoon.
- Compute, power, mounting & heat all had to fit on the vehicle. It was never designed to carry any of them. So we brought in specialist engineers who had done embedded work before, rather than learning it slowly.
How we fixed each problem
We fixed the problems one at a time, & each fix took far longer to find than it takes to read about.
| The problem | What we did | How we knew it worked |
|---|---|---|
| The camera moved with the vehicle | Measured that movement & subtracted it before solving geometry | Readings stopped changing when we passed a mast twice |
| Light changed through the day | Trained on the same routes at different hours, & adapted exposure live | Morning & afternoon runs started agreeing |
| The kit had to survive the vehicle | One on board unit, sized for the power & heat available | It ran a full shift untouched |
| A number with no place is useless | A satellite fix on every reading, at high frequency | Engineers drove straight to flagged masts |
We proved each fix on a short stretch of track first, the way any AI proof of concept should run. Order mattered too, because motion had to be solved before the light problem made sense.
Four problems sit beside the four fixes, in the order they had to be solved.
What changed after go-live?
The results after go-live are operational, because model level figures stay with the contractor. Here is what we can report & what we can’t.
| Measure | Before | After |
|---|---|---|
| Track covered in a shift | One crew on foot, covering a fixed number of masts | 10 to 20 times more, from a moving vehicle |
| Line availability | Closed or under possession | Open |
| Parameters per mast | Two, sometimes three | Five, every time |
| Where a fault shows | On a form, days later | On screen, at the mast |
| Finding that mast again | Chainage & a description | A satellite fix on every reading |
| What an engineer visits | Every mast in the section | Only the flagged ones |
The coverage figure is the contractor’s own, measured across its first year, & we haven’t audited it.
The right-hand column shows what changed, & keeping the line open is what paid for it.
Still measuring by hand behind a closure?
Tell us what your crews measure today & which vehicle could carry the kit. If you’d rather start smaller, first check how ready your team & your data are for an AI build.
What is running today?
Today the overhead wire measurement system runs in production on live routes, rather than as a pilot. It works on the contractor’s own vehicle as part of the normal maintenance cycle. Crews now use the output instead of checking it against a gauge, & that change took about a season.
Data builds up by route & by pass, so the same mast can be compared across cycles. That comparison was never part of the original ask. The maintenance team now names it as the feature they value most, & the pattern keeps showing up across our rail & logistics work.
What we would do differently
We’d change five things, listed here in the order we wish we’d known them.
- Solve the vehicle’s motion before anything else. We spent a month tuning detection when the readings were wrong for a purely mechanical reason.
- Collect data in glaring noon & low winter sun first, because they teach more than a week of easy light.
- Agree on the mounting before writing any code, because bracket design decided more than any model change did.
- Give the crew a screen from day one. They caught errors in week one that we wouldn’t have found until month three.
- Agree on a definition of correct before building, because two teams can measure the same wire & still disagree.
In our experience, that last step is the one teams tend to skip.
Where else does this pattern apply?
The same pattern shows up wherever something moves & has to be measured against a tolerance. Today a person usually does that job standing still.
| Industry | The same problem, renamed | What transfers |
|---|---|---|
| Manufacturing | Parts checked against a drawing on a moving line | Depth plus vision, plus motion correction |
| Civil infrastructure | Bridge & gantry clearance surveyed by closing a road | The whole vehicle mounted approach |
| Energy | Power line height & clearance walked by a team | Location tagging & the flagging logic |
| Warehousing | Racking & dock clearance checked on schedule | On vehicle processing, on a forklift |
| Mining | Haul road & tunnel profile measured on foot | All of it, plus dust |
In each of these fields the camera is the easy piece. Convincing the people who sign off that a moving measurement can be trusted takes far longer.
Questions buyers usually ask
What are contact wire height & stagger?
Height is how far the contact wire sits above the rails, & stagger is its offset from the track centre. The zig-zag is deliberate, so the pantograph wears evenly across its width.
Do you need lidar to measure overhead wires?
No, we used cameras with depth sensing & corrected for the vehicle’s own movement. Lidar works well, but it’s also heavy & costly, which makes it awkward to mount on a working vehicle. Skipping it kept the system light enough to fit on more than one vehicle.
Does the line have to close?
No, & that was the whole point. The vehicle runs at working speed while it measures, so surveys stop competing for track time.
What does an AI measuring system like this cost?
Cost depends on how many parameters you need & which vehicle the system mounts to. A settled environment also costs less than one that keeps changing. A narrow first version costs a fraction of a full build, so we’d rather scope than guess.
How long until overhead wire measurement runs on our vehicle?
It takes longer than the software suggests. Mounting & power work set the pace, & so does access to the vehicle. If you’re unsure the problem is ready, an AI readiness assessment is the cheaper first step.
Could this work for your setup?
Tell us what you’re dealing with & what you need measured. Mitesh Patel replies within one business day.
Services behind this case study
Six Brainy Neurals services went into this build, from the vision models to the on-board hardware.
Computer vision development
Vision models that find the wire & the mast in every frame at line speed.
Edge AI & on-device inference
Edge AI deployment on one on-board unit that keeps pace with a moving vehicle.
Sensor fusion & hardware
Depth sensing AI & vehicle motion data combined with the camera view.
AI proof of concept
Each fix proven on a short stretch of track before the full build.
Hire AI developers
Specialist engineers with embedded experience for the on-board work.
AI in logistics
Rail & logistics work where the same measure-on-the-move pattern keeps recurring.
Similar case studies
More Brainy Neurals case studies cover other industries & other kinds of AI builds.
AI Diet Assistant for Gastroenterology
Another Brainy Neurals case study, from healthcare rather than rail.
All Brainy Neurals case studies
Browse every published Brainy Neurals case study in one place.
Cite this case study
Cite this case study with the line below, which names both authors & the month it was published.
Mori, Prasiddh & Shah, Rushabh. Edge AI Overhead Wire Measurement on Moving Rail Vehicles. Brainy Neurals, August 2026. https://brainyneurals.com/case-studies/overhead-line-geometry-measurement/