








CASE STUDY · SPORTS ANALYTICS · COMPUTER VISION
Automated Basketball Video Analysis at Scale: How We Turn Raw Game Film into Box Scores in Under 40 Minutes

We engineered an automated basketball video analysis pipeline that turns single-camera game film into a full box score, an annotated game video, and highlight clips in under 40 minutes — no analyst in the loop. Built for North American youth and amateur tournament volumes of 600,000+ games a year, it holds 84.9% mean F1 across seven event classes on real gym footage.
| Stat | Context | Measurement basis |
|---|---|---|
| 84.9% mean F1 | Across 7 event classes: makes, attempts, possessions, rebounds, assists, steals, blocks (range 80.4–89.7%) | Validated against human-tagged ground truth on 118 games / ~9,600 events of single-camera amateur footage |
| Under 40 minutes | Full-game turnaround: stats CSV, annotated video, auto-cut clips | Measured end to end on one cloud GPU; ~25-minute average, <40 at p95 |
| Under $3 of infrastructure vs $60–90 fully loaded analyst cost | Under $3 of infrastructure vs $60–90 fully loaded analyst cost | Computed at fleet-scale GPU utilization |
| 600,000+ games/year | Horizontal design capacity via job queueing across a GPU fleet | Throughput math from ~58 sustained games/day per GPU |
| Zero facial recognition | Players identified by jersey digits + team classification only | Privacy-by-design for minor athletes (COPPA / BIPA-aware) |
Why manual game tagging caps every analytics product
A trained analyst needs three to four hours to tag one basketball game properly — every possession, shot, rebound, assist, steal, and block, attributed to the right player. At a fully loaded $20–25 an hour, that is $60–90 per game, plus a 24–48 hour queue when a tournament weekend drops three hundred games on the desk at once. Tagging is also subjective at the margins: two analysts working the same game disagree on 10–15% of contested events. Rebounds in traffic. Assist judgment calls. The stat sheet depends on who tagged it.
The consequence is structural. Video analytics stays an elite product, because below the pro and D1 level nobody can pay an analyst per game. Most youth and amateur games generate no structured data at all — and those are exactly the players and coaches who could use it most.
We built the computer vision engine behind a North American youth-and-amateur basketball analytics platform to take the analyst out of the loop entirely, at a design volume of 600,000+ games a year. This page covers the architecture, the five problems amateur footage forced us to solve, the accuracy numbers, and the cost math.
The four routes everyone tries first
Hiring analysts has an acceptable quality ceiling and a fatal cost curve. Cost scales linearly with games. No version of that model survives tournament volume.
Human-in-the-loop tagging services fix the staffing problem and keep everything else: per-game fees, plus a 12–48 hour queue. When the next game tips off tomorrow morning, a two-day turnaround means the film session happens after the tournament ends.
Turnkey CV products and APIs are trained on broadcast footage — multiple calibrated cameras, elevated angles, professional lighting. Point them at one tripod camera in a school gym and accuracy degrades fast. You also own nothing: no models, no weights, no roadmap control, and a per-game fee forever. (Our engagement structure exists specifically because platform companies kept hitting this wall.)
DIY open source gets a demo running in a week. YOLO plus a standard tracker looks great until two players in identical jerseys collide under the rim and appearance-based re-identification hands one kid’s rebound to another. The distance between that demo and a production system is, roughly, this entire case study.
| Dimension | Manual analyst | Tagging service | Turnkey CV product / API | Custom pipeline (this build) |
|---|---|---|---|---|
| Cost per game | $60–90 | $30–75 typical | Per-game fee, volume-priced | Under $3 infrastructure |
| Turnaround | 3–4 hrs work + 24–48 hr queue | 12–48 hours | Hours, footage permitting | Under 40 minutes |
| Accuracy consistency | 10–15% inter-tagger variance | Varies by tagger | Strong on broadcast, weak on gym footage | 84.9% mean F1 on amateur footage |
| Scale ceiling | Linear in headcount | Vendor capacity | API quotas and cost | Add GPUs |
| Data & model ownership | Yours (labels only) | Vendor terms | None | 100% — code, weights, data |
| Footage flexibility | Any | Any | Broadcast-biased | Engineered for single-camera gym film |
| Customization depth | n/a | Limited | Roadmap-locked | Full |
What does the pipeline look like from upload to box score?
An upload lands in AWS S3. A FastAPI service running on Uvicorn registers the job in SQLite, drops it on the queue, and exposes progress and status APIs so the platform can show real state instead of a spinner. From there, the game belongs to the GPU.
A GStreamer/DeepStream video analytics pipeline decodes video directly on the GPU and feeds the detection stage: YOLO-family detectors compiled to TensorRT engines handle players, the ball, and the net; an RF-DETR head reads jersey digits; a pose model supplies action cues. Multi-object tracking assigns persistent player IDs across the game. A team classifier works from jersey visual features. Court segmentation maps the floor into scoring zones.
All of it streams into the event engine — the state machine that turns detections into possessions, shot attempts, makes, rebounds, assists, steals, and blocks, each with a timestamp and a player ID. Outputs render at the end of the run: a per-player stats CSV, a fully annotated game video with scoreboard, player trails, and labels (FFmpeg handles the final mux), and auto-cut clips around every key event. Everything returns to S3 and is delivered through signed, expiring URLs.
One design rule governs the whole thing: frames never leave the GPU between decode and inference. At 600,000 games a year, every CPU–GPU memory copy is money.
-
 YOLO
YOLO -
TensorRT
- DeepStream
-
 PyTorch
 - RF-DETR
- FastAPI
- FFmpeg
- AWS S3
-
LangChain
-
Gemini
The five problems amateur footage forces you to solve
1 · Occlusion and re-identification.
Basketball is a contact sport played in a small box. Screens, box-outs, and rebound scrums destroy naive trackers. We match low-confidence detections against existing tracks instead of discarding them — the insight behind ByteTrack — so trajectories survive contact. And identity is confirmed, not assumed: whenever a jersey digit becomes readable, it re-anchors the track.
2 · Team classification when navy plays black.
Under gym lighting, navy, black, and dark purple converge. Per-frame color voting was embarrassing. The classifier that shipped aggregates jersey features across a track’s lifetime, so hundreds of frames vote and no single bad frame decides.
3 · Jersey digits under motion blur.
Per-frame digit reads sat near 62% — a coin flip with extra steps. Aggregated across a track’s lifetime, digit assignment reached roughly 94%. Same digits, same model. The difference is time.
4 · A ball that is barely there.
At 1080p, a fast ball is a few-pixel smear, and downsampled full-frame inference misses it. We run high-resolution tiled inference on the detection stage, which recovers small-object recall at a GPU cost the per-game economics can absorb.
5 · Court lines that lie.
Youth gyms layer volleyball and badminton lines over the basketball court. Zone scoring depends on knowing where the arc actually is, so we segment basketball-relevant regions directly instead of trusting line geometry.
“ “Every hard problem on amateur footage fell to temporal aggregation, not a bigger model.” ”
How does a detection become a stat?
Detection was never the bottleneck. The event engine was. It is a state machine that watches the stream of tracked objects and emits basketball.
Possession is sustained ball–player proximity plus trajectory agreement, never a single frame of contact. A shot attempt is possession ending with the ball on a rim-bound trajectory, with pose cues confirming a shooting motion. A make is a specific ball–net interaction signature. The point value comes from the shooter’s position against the segmented court zones at release — one, two, or three, with no camera calibration involved. A rebound is the first sustained possession after a miss; an assist is a completed pass leading to a make inside a time window; steals and blocks are possession flips and interrupted attempts.
Two implementation details mattered more than any model choice. First, every event carries a timestamp and a player ID, which means the engine that writes the CSV also cuts the highlight clips — clip generation costs nothing extra. Second, when attribution is genuinely ambiguous, like a rebound in a four-player scrum, the engine records the event with a low-confidence flag instead of guessing silently. Coaches forgive a blank. They do not forgive a wrong name.
“ “Detection was never the bottleneck. The state machine that turns detections into a box score is where the engineering lives.” ”
A box score you can talk to
Coaches do not open CSVs. On top of the stats layer we added a chat interface — LangChain orchestrating a Gemini Flash-class model, grounded strictly on the game database and stat exports. Ask “who scored our last ten fourth-quarter points?” and it answers from the data, or says it cannot. It has no license to invent a stat; if a query outruns the data, it says so. That grounding rule is the entire difference between a generative AI feature coaches trust and one they screenshot for the group chat.
What 600,000 games a year actually demands
Six hundred thousand games a year averages out to roughly 1,650 a day. Averages are a trap. Youth basketball happens on weekends, and a big tournament Saturday can spike intake to 4,000–6,000 games in a day. The system is engineered for the spike, not the mean.
The unit of scale is one cloud GPU. A single L4-class instance processes an average game in about 25 minutes, under 40 at p95 — call it 58 games per GPU per day, sustained. Average load needs about 29 GPUs; tournament bursts need 70–105. Workers are stateless: they pull jobs from the queue, sync state to S3, and terminate. Scaling is “add GPUs,” and nothing else changes.
The economics land at $0.50–0.85 of GPU time per game, and under $3 all-in with storage, egress, and overhead. That number is won in pipeline engineering, not model selection: GPU-resident decode, batched TensorRT engines, zero-copy frame handling — the discipline the NVIDIA DeepStream documentation exists to teach.
“ “The per-game cost is won in the pipeline — zero-copy decode and batched inference — not in the model choice.” ”
Why there is no face recognition in this system
Most of the people in this footage are minors. Face recognition would have been the easy identity solution and a serious liability: biometric identifiers trigger the Illinois Biometric Information Privacy Act and its private right of action, COPPA obligations for under-13s in the US, and GDPR’s heightened standards for children’s data in the EU.
So identity is a jersey problem here, not a biometric one. Players are identified by team classification plus jersey digits. No face embeddings are computed; no biometric templates exist anywhere in the system. Output access runs through signed, expiring URLs, and raw footage retention follows the platform’s policy rather than living indefinitely in a training bucket.
This began as an ethics call and turned out to be a commercial one. Platforms selling into schools, clubs, and youth organizations get asked exactly these questions in procurement — and “we never built the risky thing” is a much shorter conversation than “here is our biometric consent framework.”
“ “We refused to ship face recognition into gyms full of fourteen-year-olds. Jersey digits carry the identity load instead.” ”
How accurate is automated basketball event detection?
Methodology: validated against human-tagged ground truth on 118 held-out games — roughly 9,600 events — with an event scored correct only when it lands within a two-second window of ground truth and attributes to the right player. Contact-heavy attribution (rebounds, steals) is where the remaining error lives, which is exactly what the occlusion work above would predict. A comparable engagement is documented in related case study.
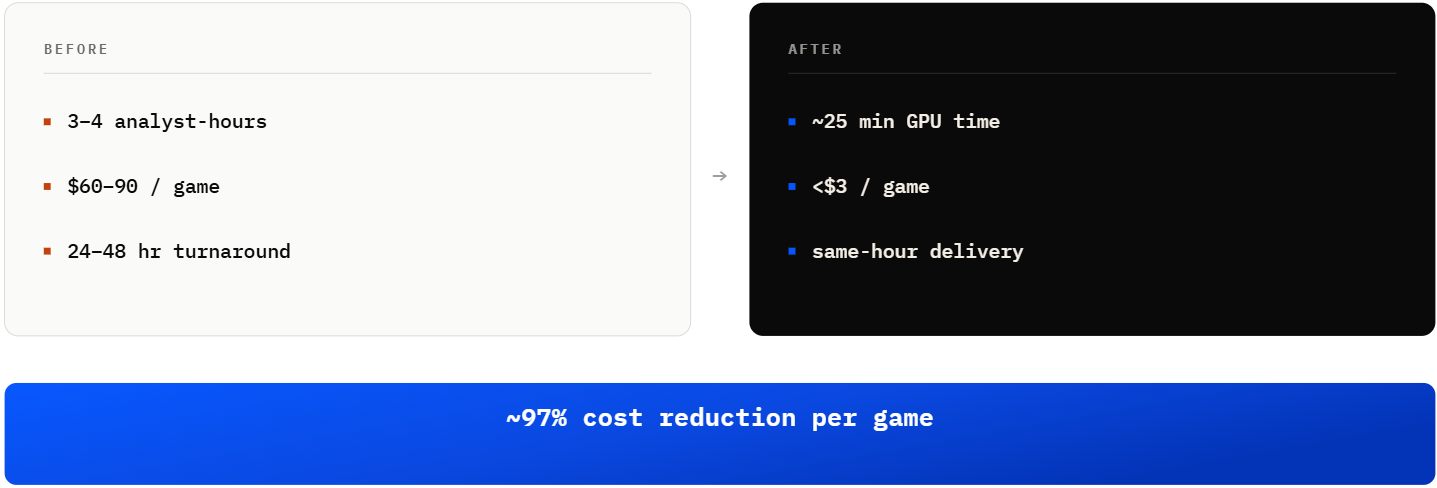
The ROI math, spelled out. A platform running 10,000 games a season pays $600,000–900,000 a year for analyst tagging at $60–90 a game. The automated pipeline processes the same volume for roughly $30,000 of infrastructure. At that spread, a build of this scope recovers its cost within the first season. And at the 600,000-game design volume, the manual model is not merely expensive — it is impossible: roughly 2.1 million analyst-hours a year, or about 1,000 full-time analysts. Automation is not the cheaper option at that volume. It is the only option.
What we’d do differently
Build the amateur-footage dataset first.
We spent the early weeks trying to transfer from broadcast-trained checkpoints, and the transfer was poor everywhere it mattered — lighting, angles, jersey quality. The dataset was the product; we just didn’t treat it that way until around week six.
Make temporal aggregation the doctrine, not the rescue.
Digits, team colors, identity, event confidence — each improved the moment we stopped trusting single frames, and we discovered it per-problem instead of designing for it on day one.
Put the accuracy effort where the F1 moves.
Halfway through, detection mAP gains stopped moving event-level F1 at all, while event-engine fixes kept moving it to the end. Given the schedule again, a month would move from model training to state-machine hardening. More on this thinking in our engineering notes.
Instrument human–machine disagreement early.
The diff harness that compares machine output against human tags game-by-game arrived later than it should have, and that cost us a partial re-labeling round. It is now the first thing we build on any perception project.
Could this run on your footage?
If you operate a sports platform, a tournament circuit, or a league, the footage bar is deliberately low: one stable camera, full court in frame, 720p or better. A phone on a tripod qualifies.
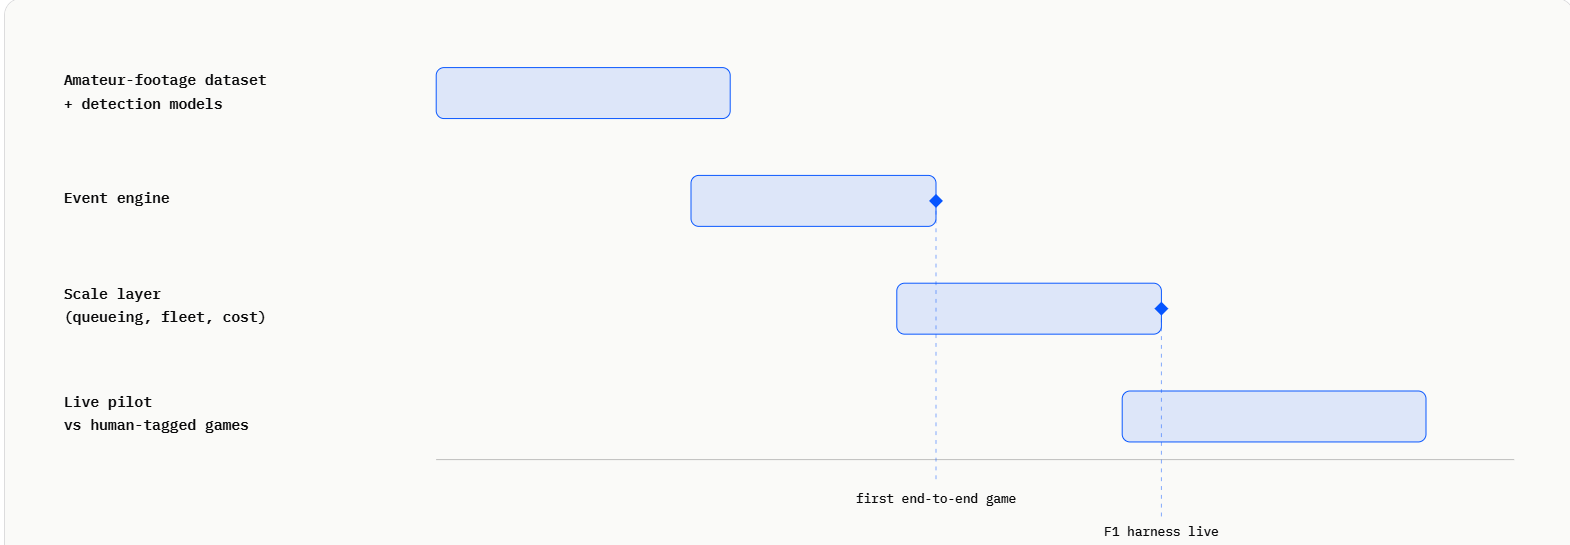
The architecture is sport-agnostic in shape. The sport lives in three places — detection classes, court segmentation, and the event state machine — so adjacent court sports like volleyball, futsal, and netball are adaptations, not rebuilds. The build ran in four phases: the amateur-footage dataset and detection models, the event engine, the scale layer, then a live pilot against human-tagged games.
On ownership, the terms that applied here apply to client builds: you receive every line of code and every model weight — 100% IP transfer with a full handover, and no per-game fees back to us. I’m an NVIDIA-certified AI architect, Brainy Neurals is an NVIDIA Inception partner, and this is an NVIDIA-stack build end to end — the kind of project that certification is supposed to mean something for. Nine-plus years of production AI sit behind the decisions on this page; the About page covers the team behind the rest.




Frequently asked questions
How accurate is automated basketball video analysis?
Can AI generate a full box score from a single camera?
How long does it take to process one game?
What does automated analysis cost per game compared to manual tagging?
Does it work on phone or tripod footage from any gym?
How is young athletes’ privacy protected?
Can the pipeline extend to other sports?
Where this goes next
The unit economics now exist for every game — not every televised game, every game — to generate structured data. The pipeline’s next steps are already scoped: additional court sports on the same architecture, and a real-time mode that trades a little accuracy for sideline-speed feedback between quarters. The interesting shift is who gets analytics: for the first time, a fourteen-year-old’s AAU season can produce the same class of data an NBA scout works from.
If you’re building a sports platform, running a tournament circuit, or weighing what automated video intelligence would take in your environment, everything above is a fair preview of how we think. More engagements live in the case study library.
Where are you in the journey?
Just exploring
Get the reference architecture (PDF — email gate)Evaluating
Get a 15-min architecture walkthroughReady to scope
Book a 30-min discovery call